-
iestinstrument
Evaluating Battery Electrode Formulations and Processes via Electrode Resistance Measurement
1. Abstract
Electrode resistance is a sensitive, process-coupled metric that reflects slurry formulation, conductive-additive loading and calendering/compaction conditions. This study uses a controlled four-probe, pressure-applied measurement workflow (BER1300) to quantify how conductive-carbon content and compaction density affect the electronic conductivity of positive and negative electrode sheets. Statistical analysis shows clear, material-dependent thresholds where further increases in conductive additive or compaction yield diminishing returns. These results give R&D teams practical guidance to balance electrode resistance, compaction density and energy-density targets during electrode formulation and process development.
2. Preface
As an important intermediate product in the production process of lithium-ion batteries, electrodes must be monitored and controlled reliably to ensure excellent performance and stability. The advantages and disadvantages of electrode formulations and process parameters can greatly affect the final performance of lithium-ion batteries in terms of cycling, multiplication rate, safety, and so on. Electrode sheet contains active material, conductive agent and binder, in order to improve the energy density of lithium-ion battery, the proportion of active material is higher and higher, but the appropriate proportion of the conductive agent content and the type of conductive agent on the performance of the battery multiplication should not be ignored [1-6]. In the electrode sheet rolling process, set the appropriate roller pressure to ensure that the compacted density of the electrode sheet is in the appropriate range, and then achieve the balance of the electrode sheet electronic and ionic conductivity, to the R&D and the development and development of the electronic and ionic conductivity of the electrode sheet, to ensure the stability of the performance of the electrode sheet. The balance of ionic conductance is also a big challenge for researchers.
3. Experimental Setup and Methodology
3.1 Experimental equipment
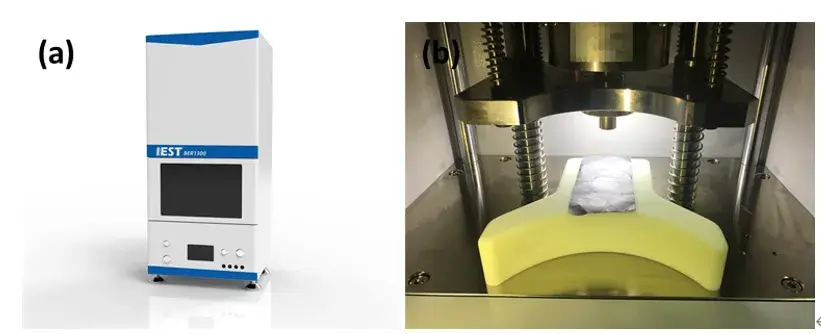
The Electrode Resistance Meter BER1300 (IEST), was employed. This instrument features a 14 mm diameter electrode and can apply controlled pressure from 5 to 60 MPa. The equipment is shown in Figure 1(a) and 1(b).
Figure 1. (a) BER1300 appearance; (b) BER1300 structure
3.2 Test method
Electrode sheets were cut into approximately 5 cm x 10 cm rectangles and placed on the sample stage. Using the MRMS software, parameters such as test pressure and holding time were set before initiating the measurement. The software automatically records data including electrode thickness, resistance, resistivity, and conductivity.
4. Data analysis
4.1 Impact of Conductive Carbon Content in Cathode Electrode Sheets
Cathode active materials typically exhibit poor intrinsic conductivity. Therefore, incorporating a certain proportion of conductive agent is crucial for enhancing electrode conductivity, akin to “providing fuel in snowy weather.”
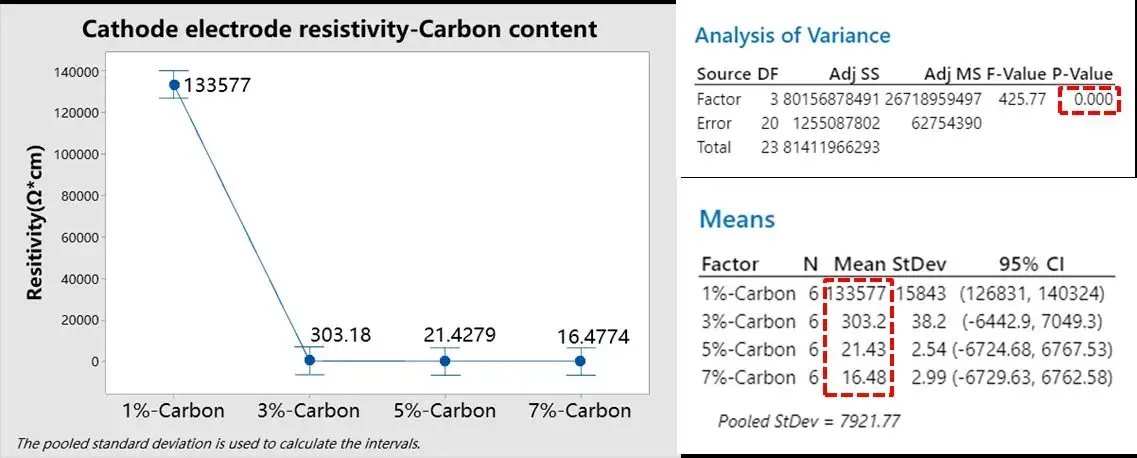
We prepared NCM cathode sheets with varying conductive carbon contents: 1%, 3%, 5%, and 7%, while keeping other process parameters constant. The BER1300 was used to measure electrode resistivity under a set pressure of 25 MPa and a holding time of 25 seconds. Five parallel tests were conducted for each group; results are shown in Figure 2.
Analysis of variance (ANOVA) performed using Minitab on the resistivity data for the four groups yielded a P-value < 0.05, indicating statistically significant differences. The trend of the mean values clearly shows that resistivity gradually decreases as conductive carbon content increases. However, the reduction becomes less pronounced once the carbon content exceeds 5%. Developers can use this data to determine the optimal conductive carbon ratio, balancing electronic conductivity against the target energy density of the battery.

Figure 2. Analysis of variance of resistivity for NCM cathodes with four different conductive carbon contents
4.2 Impact of Conductive Agent Content in Anode Electrodes
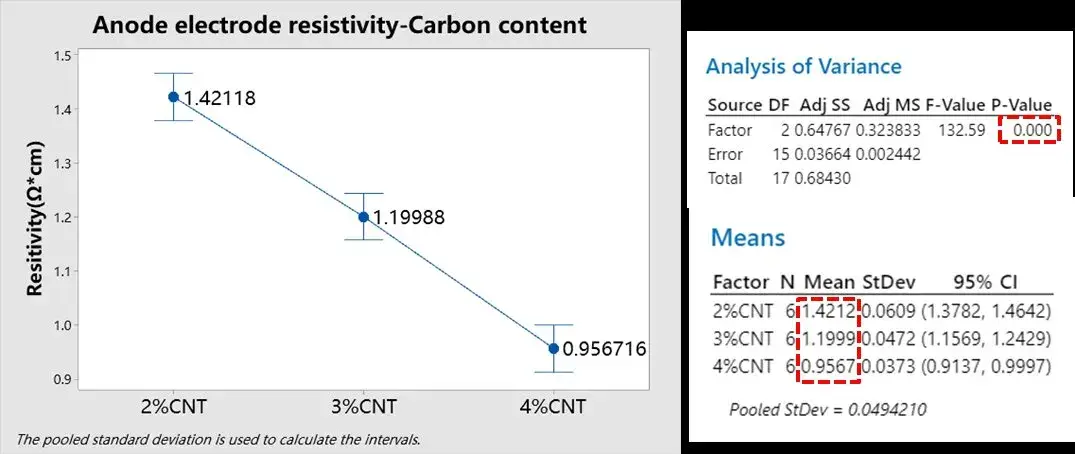
In the cathode electrode, since the graphite material itself has good conductivity, adding a conductive agent with better conductivity is “icing on the cake”. The content of carbon nanotubes in the graphite electrode was changed to 2%, 3%, and 4%, respectively, and other process parameters remained unchanged. The electrode resistivity was tested using BER1300, the test pressure was set to 25MPa, the pressure holding time was 25s, and the parallel samples were tested 5 times. The results are shown in Figure 3. Minitab was used to perform variance analysis on the resistivity of the three groups of electrode sheets with different carbon nanotube contents. From the test results, it can be seen that P<0.05, indicating that the resistivity of the three groups of electrode sheets is significantly different, and from the change law of the mean, it can be seen that with the increase of the conductive agent content, the resistivity of the graphite electrode sheet almost shows a linear decrease, indicating that the addition of carbon nanotubes can improve the electronic conductivity of the electrode sheet. R&D personnel can determine the optimal conductive agent ratio based on the requirements for battery energy density.

Figure 3. Variance analysis of resistivity of graphite electrodes with three groups of different conductive agent contents
4.3 Impact of Compaction Density of Electrode Sheets
Compaction density significantly affects electrode porosity and tortuosity, thereby influencing both electronic and ionic conductivity.
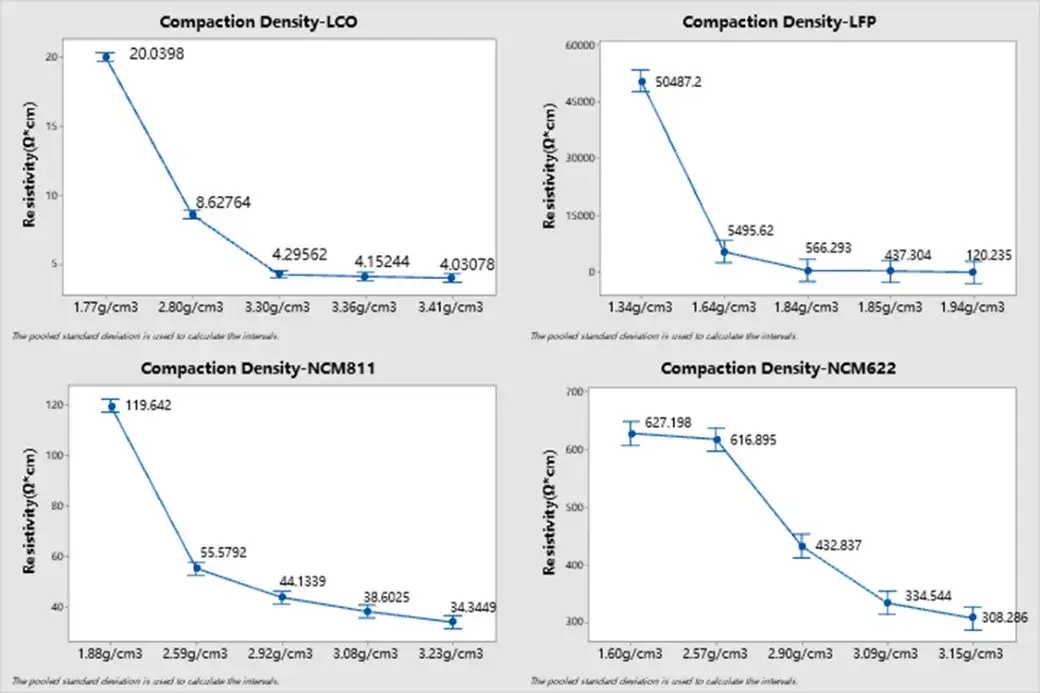
Four different cathode types were calendered under varying pressures to achieve different compaction densities, while other parameters remained constant. Their resistivity was measured at 5 MPa with a 25-second hold time (n=5). The results, plotted in Figure 4, show a consistent decrease in resistivity with increasing compaction density across all four materials. However, the rate of decrease (curve slope) varies.
For LiCoO₂ (LCO) cathodes, resistivity reduction becomes less significant beyond a compaction density of ~3.3 g/cm³. LiFePO₄ (LFP) cathodes require a compaction density above approximately 1.84 g/cm³ for resistivity to stabilize. For the two NCM cathodes with different nickel contents (NCM811 and NCM622), the resistivity decrease slows down beyond a compaction density of ~3.08 g/cm³. Notably, the higher-nickel NCM811 exhibits lower resistivity, suggesting that increased nickel content enhances the electronic conductivity of the electrode.

Figure 4. Variance analysis of resistivity of four groups of anode electrode sheets under different compaction density conditions
5. Summary
This study demonstrated the application of the electrode resistance method for evaluating the impact of conductive agent content and compaction density on the electronic conductivity of lithium-ion battery electrodes. The results confirm that increasing conductive agent content and compaction density both enhance electrode conductivity. Research and development personnel can utilize this method, in conjunction with energy density and ionic conductivity requirements, to efficiently determine the optimal electrode formulation and calendering process parameters.
5. References
[1] Xu Jieru, Li Hong, et al. Conductivity test and analysis methods for research of lithium batteries[J]. Energy Storage Science and Technology, 2018, 7(5) 926-955.
[2] Hiroki Kondo et al. Influence of the Active Material on the Electronic Conductivity of the Positive Electrode in Lithium-Ion Batteries[J]. Journal of the Electrochemical Society, 2019,166 (8) A1285-A1290.
[3] B.G. Westphal et al. Influence of high intensive dry mixing and calendering on relative electrode resistivity determined via an advanced two point approach[J]. Journal of Energy Storage 2017, 11, 76–85.
[4] Rinaldo Raccichini, Alberto Varzi, Stefano Passerini and Bruno Scrosati,The role of graphene for electrochemical energy storage[J],Nature Materials, 2015 , 3, 14.
[5] Wu Xiangkun, Zhan Qiushe, Zhang Lan, Zhang Suojiang. Microstructure optimization and controllable preparation technology progress of lithium battery electrode sheet [J]. Applied Chemistry, 35(9): 1076-1092.
[6] Nobuhiro Ogihara,et al.Impedance Spectroscopy Characterization of Porous Electrodes under Different Electrode Thickness Using a Symmetric Cell for High Performance Lithium-Ion Batteries[J].The Journal of Physical Chemical C, 2015, 119(9):4612-4619.
Contact Us
If you are interested in our products and want to know more details, please leave a message here, we will reply you as soon as we can.


