Angelw Article Appreciation - New LiCoO2 material with both rate performance and cycle performance

1.Research Background
In lithium-ion batteries, cathode materials, as the main part of lithium-ion diffusion and electron transmission, largely determine the performance of the battery. The ion diffusion characteristics of the positive electrode have been the focus of research, but there are few studies on the electron transport characteristics. The specific capacity of the same type of positive electrode is significantly different when the same cut-off voltage is set, which is likely to be limited by the impact of electronic transmission. Generally, the removal/insertion of lithium ions in a single particle is driven by the applied effective potential (Veff), which is determined by the potential (Vo) applied to each particle and the potential drop (IR) caused by the surface resistance. If R value increases, Veff will decrease and available lithium ion will decrease. In short, the magnification performance is greatly affected by the surface conductivity. Therefore, we can improve the rate performance of the positive electrode by increasing the surface conductivity.
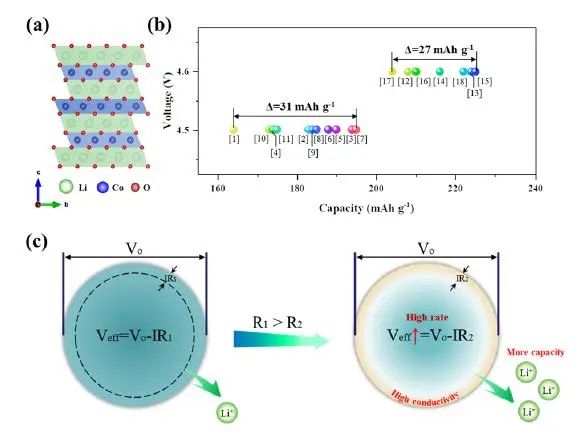
Figure 1. (a) The hierarchical structure of LCO; (b) It has been reported in the literature that the initial discharge capacity of LCO at a rate of 0.1C at a cut-off voltage of 4.5V and 4.6V respectively; (c) Schematic diagram of strategies for improving the magnification performance of cathode materials by adjusting the surface conductivity
2.Article Summary
Recently, the team of Dr. Xu Shenyang and Professor Pan Feng from Peking University and Professor Zhang Mingjian from the Chinese University of Hong Kong (Shenzhen) have constructed a (Li/Co/Al) (O/F) surface layer with unique disordered rock salt structure on the surface of LCO. The multi-scale conductivity test shows that this method can significantly improve the surface conductivity of LCO. The surface generates rich vacancies and fast electron transmission, thus improving the voltage Veff effectively applied on the internal layered lattice. For the first time, through the concept of effective voltage Veff, the characteristics of Li+disembedding/embedding in the positive electrode are associated with the characteristics of surface electron transmission.
Furthermore, the author comprehensively analyzed the influence of the increase of electronic conductivity on the electrochemical process, structural phase transition, chemical valence, surface reaction and other aspects, and demonstrated the influence of the increase of electronic conductivity on the ionic conductivity from both experimental and multi-physical field simulation. These findings have deepened the understanding of the electron/Li+transport characteristics in cathode materials and opened up a new direction for the development of fast charging/discharging cathode materials. Relevant achievements were published in the international top journal Angelw. Chem., Int. Ed. with the title of "Promoting Surface Electric Conductivity for High-Rate LiCoO2".
3.Appreciation of Pictures and Texts
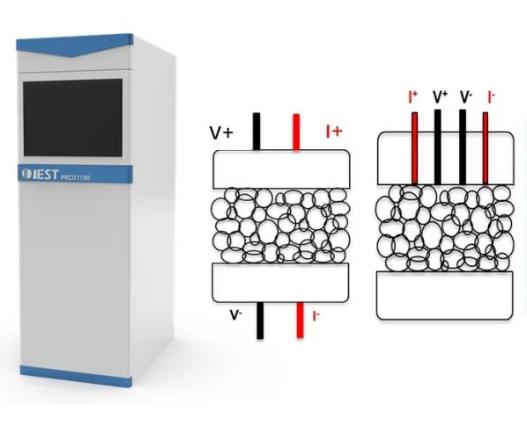
As shown in Figure 2, due to the disordered rock salt (Li/Co/Al) (O, F) structure on the surface, the surface treated LCO (LCO-M1) becomes highly conductive, and the modified LCO phase is characterized by various test methods for conductivity at different scales. The equipment used includes four-probe powder resistance (PRCD1100, IEST), AFM, EPR, etc.
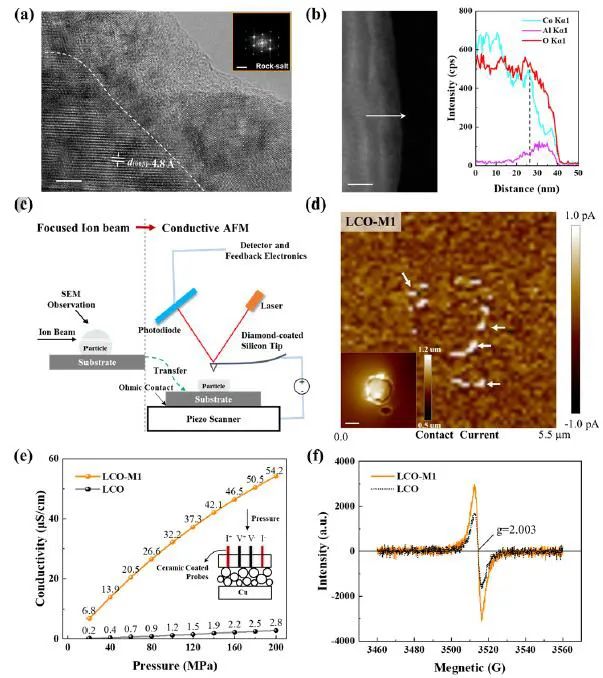
Figure 2. Characterization experiment of surface conductivity, in which (a) HRTEM diagram of LCO-M1 phase and FFT conversion of selected region. The scale of HRTEM and FFT is 5 (nm) and 5 (1/nm) respectively; (b) TEM diagram of LCO-M1 phase and corresponding ED X-ray scanning along the arrow direction; (c) Schematic diagram of AFM conductivity test of single particle on cross section; (d) AFM contact current diagram of single particle on cross section. The illustration shows the corresponding height distribution image with a scale of 1 μ m; (e) The conductivity of LCO and LCO-M1 powder at different pressures was measured by four-probe method (PRCD1100, IEST); (f) EPR spectra of LCO and LCO-M1 powder.
As shown in Figure 3, due to the high surface conductivity and the internal stable structure of disordered rock salt phase, the modified LCO has both ultra-high magnification performance and long cycle stability. In addition, the time of flight secondary ion mass spectrometry (ToF-SIMS) shows that the modified LCO has a more uniform positive electrolyte interface (CEI) layer, and is mainly composed of LiF₂-- and other inorganic substances. This can effectively inhibit the side reaction and lattice oxygen loss.
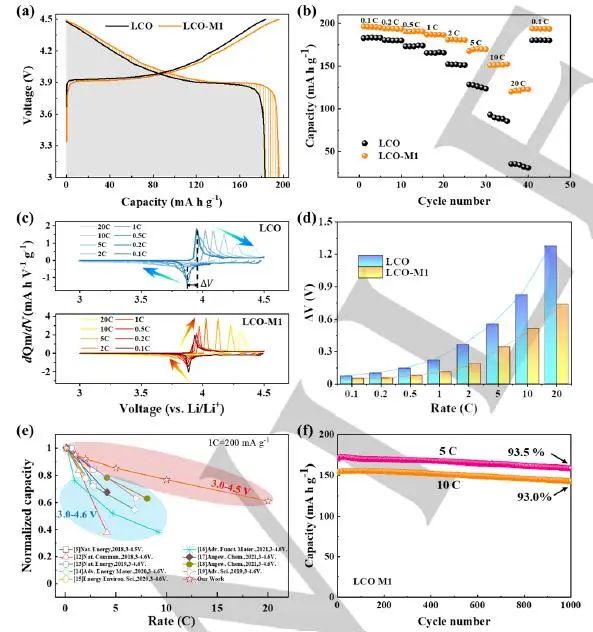
Figure 3. (a) The capacity-voltage curve of the second cycle of LCO and LCO-M1 phases in the voltage range of 3.0-4.5V at the rate of 0.1C; (b) Multiplication performance test of LCO and LCO-M1 phase in the voltage range of 3.0-4.5V at 25 ℃; (c) In the voltage range of 3.0-4.5V, the dQm/dV curve of LCO and LCO-M1 phase at different magnification, in which the arrow shows the change trend of redox peak; (d) Δ Correlation between V and magnification, where Δ V is defined as the voltage difference between the charging peak and the discharging peak in the dQm/dV curve, which is used to quantify the change of polarization; (e) Comparison of magnification performance between LCO-M1 phase and reported LCO phase; (f) Long-cycle performance comparison of LCO-M1 at 5C and 10C magnification, where the voltage range is 3.0-4.5V.
Figure 4 shows that the orderly Li+transmission channel formed in LCO-M1 phase after circulation is conducive to the rapid insertion or removal of Li+. In addition, combining FIB-EDX/SEM (Figure S23), ToF-SIMS (Figure S24) and impedance spectrum relaxation time distribution (DRT) analysis (Figure S25), it can be found that the increased Li+diffusion ability may come from the dense and stable CEI layer, which allows the rapid passage of Li+and electrons.
LCO-M1 has better surface conductivity and higher effective voltage, which enables the lithium de-insertion phase transition to occur at a lower applied voltage. The authors used the L-edge of Co and the K-edge soft X-ray absorption spectrum (SXAS) of O to track the chemical state changes of LCO-M1, and found that the formation of Co ₂+and spinel phase in LCO-M1 was earlier than that of traditional LCO. In addition, LCO-M1 has a higher peak value at 4.5V than the traditional LCO, which is consistent with the higher capacity of LCO-M1.
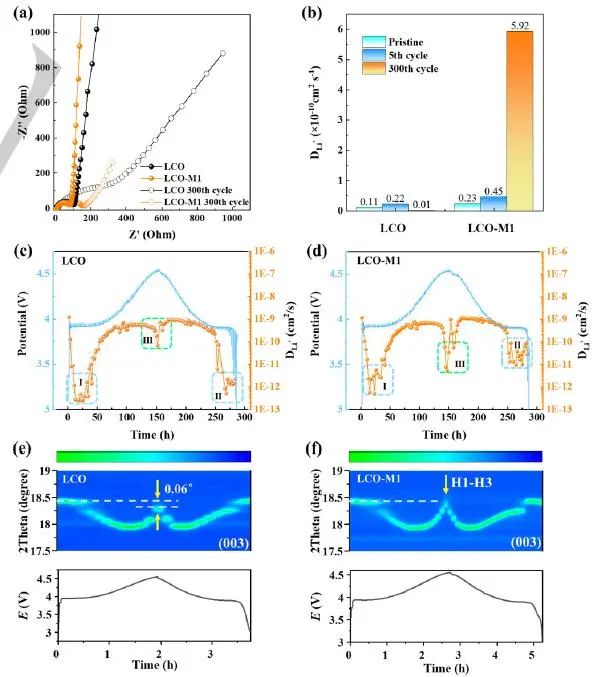
Figure 4. Effect of electronic conductivity on Li+diffusion and phase transition. (a) EIS curve of LCO and LCO-M1 before and after 300 cycles in 3.0-4.5V voltage range at 1C magnification; (b) Fit the EIS results in the figure (a) and calculate the diffusion coefficient (DLi+) of Li+in LCO and LCO-M1; (c) And (d) are the GITT test results of LCO and LCO-M1 during the first charging/discharging process; (e) And (f) are the in-situ changes of (003) XRD diffraction peaks of LCO and LCO-M1, and the corresponding electrochemical curves.
In Figure 5, the author uses a schematic diagram to describe the electrochemical mechanism of LCO-M1 after surface modification. The modified disordered rock salt phase surface has three characteristics: ① stable skeleton, ② good Li+percolation network, and ③ high conductivity. The stable structure protects the internal layered lattice and ensures that it can be stably circulated for a long time. In addition, the surface can generate rich vacancies, which is conducive to the rapid transmission of electrons, thus improving the voltage effectively applied on the internal layered lattice and stimulating the deeper phase transition process. Therefore, LCO-M1 can embed or remove more Li+within the same working voltage range, which improves the multiplier performance of the cell.
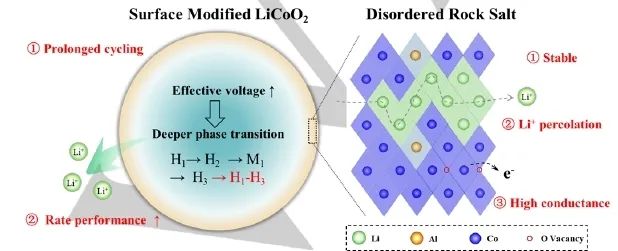
Figure 5. Design diagram of high magnification materials. The surface structure has high stability and good Li+diffusion dynamics under long cycle and high magnification conditions.
In Figure 6, the author proved through finite element simulation that LCO-M1 with higher surface conductivity has longer discharge time, that is, greater specific capacity. In addition, LCO-M1 particles also show a more uniform surface potential distribution and a higher end-discharge potential, which makes the diffusion rate of Li+in LCO-M1 particles faster. In addition, the author also studied the distribution of Li+concentration at different discharge times, which further confirmed that high surface conductivity is conducive to the rapid embedding of Li+in LCO-M1 (which is consistent with the experimental results).
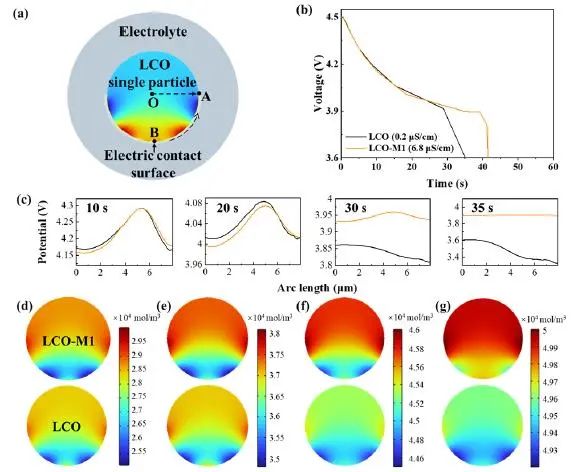
Figure 6. The effect of surface conductivity on electrochemical performance was studied by finite element simulation. (a) Model of finite element simulation; (b) Discharge curves of low surface conductivity LCO and high surface conductivity LCO; (c) When the discharge time is 10s, 20s, 30s and 35s, the surface potential distribution along the BA arc (marked in the figure (a)); (d-g) is the distribution of Li+concentration when the discharge time is 5s, 10s, 20s and 30s respectively.
4.Summary
The author innovatively improves the rate performance of cathode materials by improving the surface conductivity. In order to verify the strategy, the author constructed a disordered rock salt type (Li/Al/Co) (O/F) layer on the surface of the positive pole of the LCO. The electrical conductivity of single particle, powder and electrode samples showed that the electronic conductivity of the surface modified LCO-M1 was more than one order of magnitude higher than that of the traditional LCO. LCO-M1 significantly increases the effective voltage applied to a large number of individual particles, and drives more Li+insertion/removal under the same external voltage, finally achieving excellent multiplier performance (154mAh/g for g capacity at 10 C and 3.0-4.5V), as well as excellent cycle performance due to inherent structural stability (capacity retention rate is still~93.0% after 1000 cycles at 10 C). In addition, the author has also for the first time associated the insertion/removal characteristics of Li+in the positive electrode with the surface electron transmission characteristics through the concept of effective voltage Veff. These findings have deepened people's understanding of the electron/Li+transmission characteristics in the positive electrode materials, and opened up a new direction for the development of fast charging and discharging positive electrode materials.
5.Recommended Test Equipment
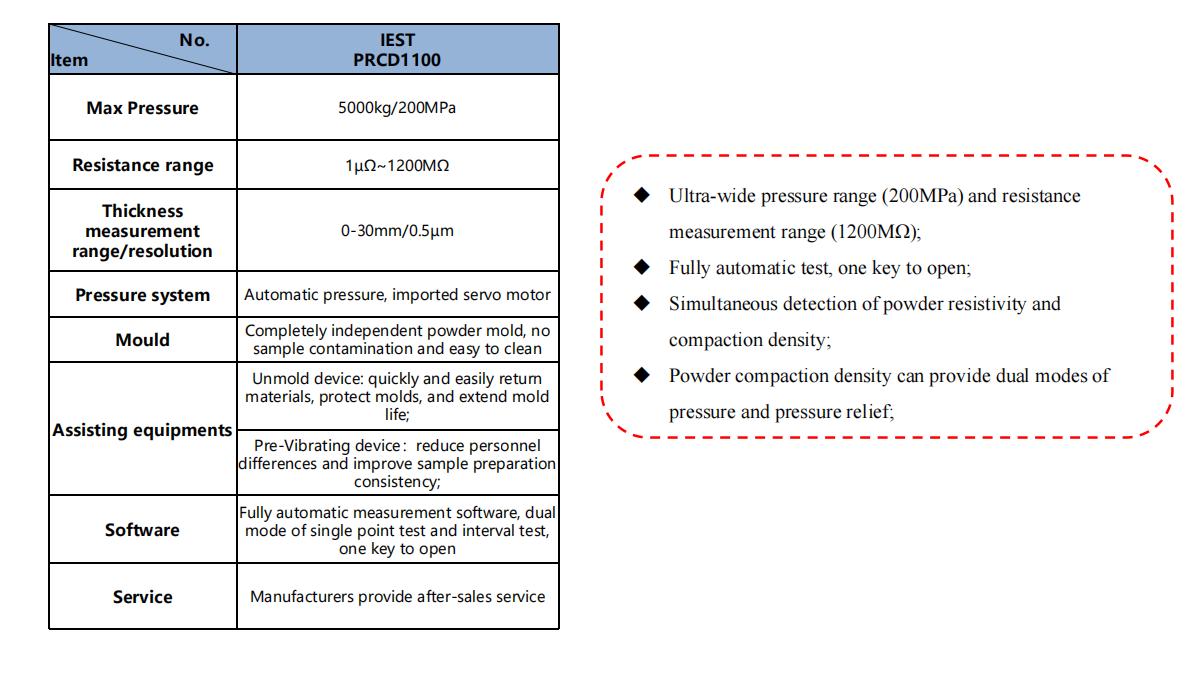
IEST Powder Resistance &Compaction Density(PRCD1100)
6.Original Document
S.Y. Xu, X.H. Tan, W.Y. Ding, W.J. Ren, Q. Zhao, W.Y. Huang, J.J. Liu, R. Qi, Y.X. Zhang, J.C. Yang, C.J. Zuo, H.C. Ji, H.Y. Ren, B. Cao, H.Y. Xue, Z.H. Gao, H.C. Yi, W.G. Zhao, Y.G. Xiao, Q.H. Zhao, M.J. Zhang* and F. Pan*. Promoting Surface Electric Conductivity for High-Rate LiCoO2. Angewandte Chemie International Edition.
https://doi.org/10.1002/anie.202218595
