Influence of Pole Area on Pole Resistance
Battery resistance affects the basic performance of the battery, including the battery power performance and the reliability and safety of the battery, and the polar resistance, as part of the battery resistance, has also been used in the development and production process to evaluate the material, formulation and process stability.The electrode resistance is composed of coating resistance, fluid collector resistance, particle contact resistance, etc. The test of the electrode resistance can achieve the following purposes:
1.Comprehensive evaluation of the slurry stability of mixing to coating process, to identify the agglomeration of conductive agent.
2.Mixed uniform anomaly identification of hybrid electrodes such as silicon-carbon anode.
3.Evaluation of the electronic conductivity for different material formulations.
4.For battery failure analysis, quickly locate the positive and negative electrode resistance change difference.
During the test of the electrode plate resistance, whether the distribution of the applied current field will be affected by the area of the electrode plate resistance is a concern of the surveyor as to the stability of the resistance data.In this paper, by testing the positive and negative electrode plate resistance of different areas, we hope to increase the influence degree of the energy electrode plate area through the experimental data, and then provide a reliable reference value for the development and production process personnel.
1.Experimental Equipment and Test Methods
1.1 Experimental Equipment: Pole sheet resistor, model BER2500 (IEST), electrode diameter of 14mm, with applied pressure of 5~60MP a; the appearance of the equipment is as shown in Figure 1.
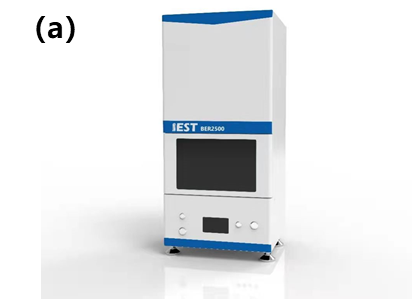 | 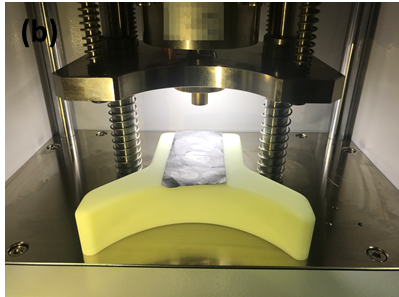 |
Figure 1. (a) BER2500 Appearance Diagram (b) BER2500 Structure Diagram
1.2 Test Method: Cut the positive and negative electrode pieces into 6 area sizes, as shown in Figure 2, place the electrode sheet on the sample table, and set the parameters such as test pressure and pressure retention time on the M RMS software to start the test. The software automatically reads the electrode thickness, resistance, resistivity, conductivity and other data.
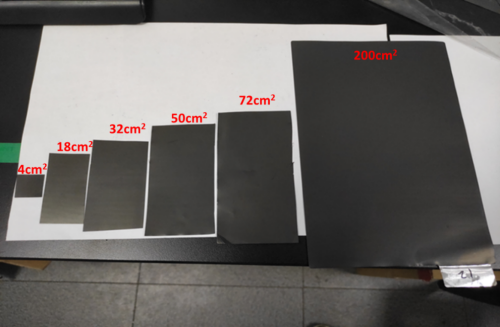
Figure 2. Polar Sheets of Different Area Dimensions
2. Data Analysis
2.1 Pole Resistance Test of Different Areas of Positive and Negative Electrodes
Cut the positive and negative electrode plate into 6 size electrode plate resistance test, Five groups of parallel samples were tested for each sample, As shown in Figures 3 and 4; The boxplot shows that the minimum resistivity of the negative electrodes of different sizes is about 2 Ω * cm, Maximum size is about 2 Ω * cm, The difference is approximately 27%, From the mean, five data standard deviations from 0 to 0, The P-value in the ANOVA was 0, This indicates that the five groups of data have significant differences; The minimum positive electrode sheet resistivity is about 29 Ω * cm, Maximum size of about 32 Ω * cm, The difference is approximately 10.3%, From the mean, five data standard deviation from 0 to 1, The P-value in the ANOVA was 0, Also shows that the five data groups have significant differences, But is this due to the difference in the polar resistance because of the size of the area, We cannot yet draw an absolute conclusion that, Therefore, 20 points were randomly taken at different positions in the same pole sheet, Compared with the sum of the electrode sheet resistivity of these 6 sizes.
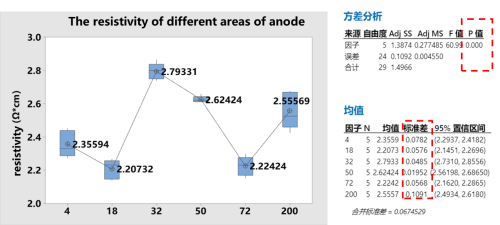
Figure 3. Resresistivity of Negative Electrode
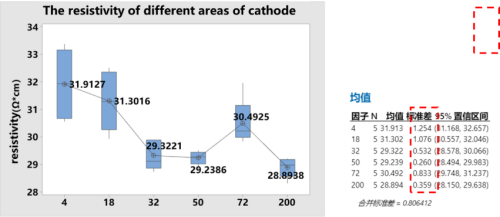
Figure 4. Positive Pole Different Area resistivity & ANOVA
2.2 The Random Point Test on the Pole Plate and the Sum of the Resistivity of 6 Sizes
As can be seen from Figure 5, the mean resistivity of negative random pole point test is about 2 Ω * cm, and the mean total resistivity of pole resistance is about 2 Ω * cm. The difference between the two is about 3.6%. The standard deviation is 0 and 0, and the P value of ANOVA is 0, indicating that there is no significant difference between the two. As can be seen from Figure 6, the mean resistivity of random point test is about 29.8 Ω * cm, and the total mean of electrode resistivity is about 30.2 Ω * cm. The difference between the two is about 1.32%. The standard deviation is 1.21 and 1, and the P value of ANOVA is 0.357, which also shows that the difference is not big. Therefore, combined with the data of 2.1, it can be basically determined that the pole area area has a small influence on the resistance, while the different positions of the selected pole area have a large influence on the resistance.
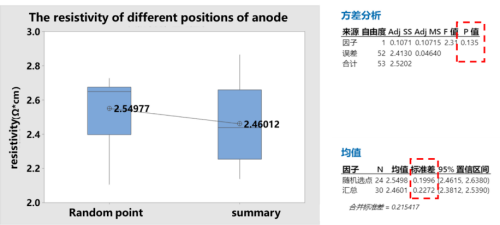
Figure 5. Random point resistivity and total resistivity of different sizes
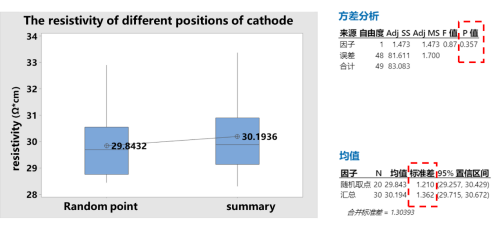
Figure 6. The sum of point resistivity of different sizes
3.Summary
This paper uses different pole area assessment of positive and negative pole resistance difference, and compared with the same pole of random points in different positions, found that different area of resistance value difference is not caused by the change of pole area, but with the location of the test, so remind the tester in the pole resistance test, pay attention to the influence of the location on the test results.
