Lithium-ion Battery Pole Piece Formula and Process Evaluation-battery Electrode Resistance Method
As an important intermediate product in the production process of lithium-ion batteries, pole pieces must adopt reliable monitoring methods to ensure their excellent performance and stability. Cycle, rate, safety and other performance. The pole piece contains active materials, conductive agents and binders. In order to increase the energy density of lithium-ion batteries, the proportion of active materials is getting higher and higher, but the influence of the appropriate proportion of conductive agent content and the type of conductive agent on the battery rate performance is also 2-7 that cannot be ignored. In the pole piece rolling process, it is also a big challenge for R&D personnel to set a suitable rolling pressure to ensure that the compaction density of the pole piece is within an appropriate range, and to achieve a balance between the electron conductance and ion conductance of the pole piece.
In this paper, the pole piece resistance method is used to evaluate the influence of the content of the conductive agent in the pole piece and the compaction density on the electronic conductivity of the pole piece, which provides strong support for the research and development personnel to determine the optimal formula and process parameters.
1.Experimental Equipment and Test Methods
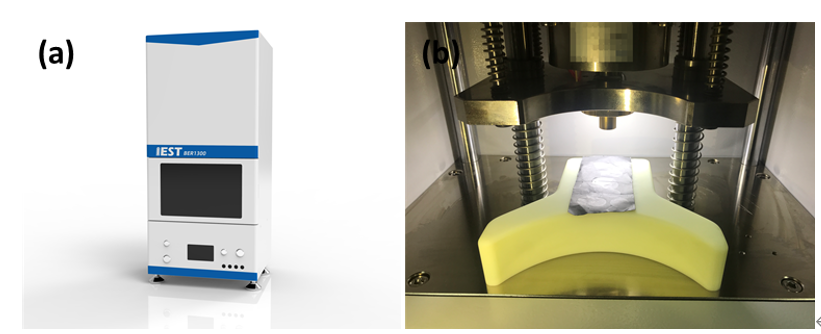
1.1Experimental Equipment: Electrode resistance meter, model BER1300 (IEST),electrode diameter 14mm, can apply pressure 5~60MPa. The device is shown in Figures 1(a)and1(b).

Figure 1. (a) Appearance of BER1300; (b) Structure of BER1300
1.2 Test Method: Cut the pole piece to be tested into a rectangular size of about 5cm×10cm, place it on the sample stage, set the test pressure, pressure holding time and other parameters on the MRMS software, start the test, and the software will automatically read the thickness of the pole piece , resistance, resistivity, conductivity and other data.
2. Data Analysis
2.1 Effect of Conductive Carbon Content in the Positive Electrode Sheet
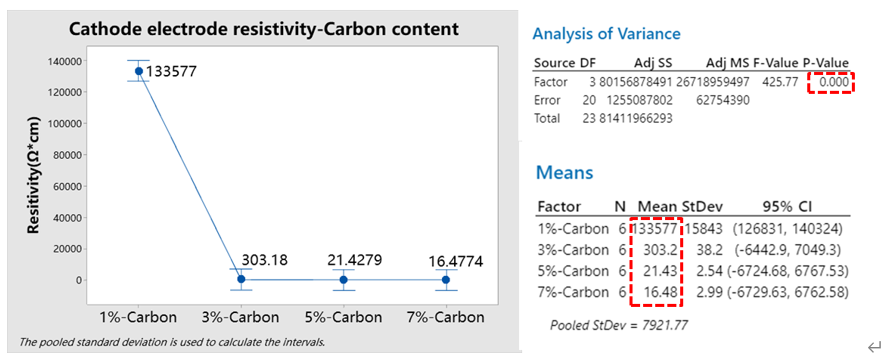
For the positive pole piece, due to the poor conductivity of the active material itself, adding a certain proportion of conductive agent is undoubtedly a "send charcoal in the snow" to improve the conductivity of the pole piece. Change the content of conductive carbon in the ternary pole piece to 1%, 3%, 5%, 7% respectively, and keep other process parameters unchanged. Use BER1300 to test the resistivity of the pole piece. The test pressure is set to 25MPa, and the holding time is 25s. The parallel samples were tested 5 times, and the results are shown in Figure 2. Using minitab to analyze the variance of the resistivity of four groups of pole pieces with different conductive carbon contents, it can be seen from the test results that P<0.05 shows that the resistivity of the four groups of pole pieces has significant differences, and it can be seen from the change rule of the mean value that as the conductive carbon As the content increases, the resistivity of the ternary pole piece decreases gradually. When the conductive carbon content is greater than 5%, the resistivity decreases by a small amount. The research and development personnel can determine the optimal conductive carbon ratio according to the requirements of the energy density of the battery.

Figure 2. Variance analysis of resistivity of four groups of ternary pole pieces with different conductive carbon contents
2.2 Influence of the Content of Conductive Agent in the Negative Pole Piece
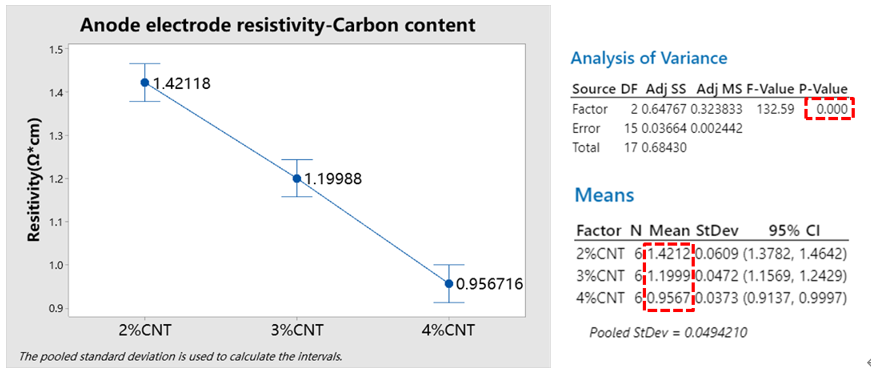
In the negative electrode sheet, since the graphite material itself has better conductivity, adding a conductive agent with better conductivity is "icing on the cake". Change the content of carbon nanotubes in the graphite pole piece to 2%, 3% and 4% respectively, keep other process parameters unchanged, use BER1300 to test the resistivity of the pole piece, set the test pressure to 25MPa, hold the pressure for 25s, and test in parallel 5 times, the result is shown in Figure 3. Using minitab to analyze the variance of the resistivity of the three groups of pole pieces with different carbon nanotube contents, it can be seen from the test results that P<0.05 shows that there are significant differences in the resistivity of the three groups of pole pieces. With the increase of the additive content, the resistivity of the graphite electrode sheet decreases almost linearly, indicating that the addition of carbon nanotubes can improve the electronic conductivity of the electrode sheet. The research and development personnel can determine the optimal ratio of conductive agent according to the requirements of the energy density of the battery.

Figure 3. Analysis of variance of resistivity of three groups of graphite pole pieces with different conductive agent contents
2.3 Influence of Compaction Density of Pole Piece
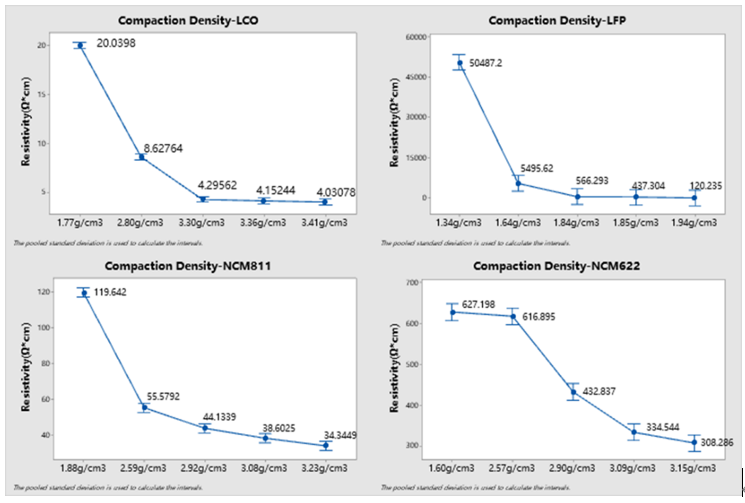
The compaction density affects the porosity and tortuosity of the pole piece, and then affects the electron conductance and ion conductance of the pole piece. Different pressures are applied to the 4 kinds of positive pole pieces, and the other parameters are the same, and pole pieces with different compaction densities can be obtained. BER1300 is used to test the resistivity of the pole pieces. The test pressure is set to 5MPa, the holding time is 25s, and parallel samples are tested 5 times. , and the result is shown in Figure 4. From the change trend of resistivity, the resistivity of the four pole pieces all decreased with the increase of compaction density, but the slopes of the curves were different. For lithium cobalt oxide (LCO) pole pieces, when the compaction density reaches 3.3g/cm3, the decrease in resistivity is not significant, and the compaction density of lithium iron phosphate (LFP) pole pieces should reach 1.84g/cm3 Above the above, the resistivity gradually tends to be stable, but for the two kinds of NCM811 and NCM622 ternary pole pieces with different nickel contents, when the compaction density reaches 3.08g/cm3 or more, the resistivity decreases tends to be slow, and with the As the nickel content increases, the resistivity of the pole piece also decreases, indicating that increasing the nickel content can improve the electronic conductivity of the pole piece.

Figure 4. Variance analysis of the resistivity of four groups of positive pole pieces under different compaction densities
3.Summarize
In this paper, the pole piece resistance method is used to evaluate the influence of the content of the conductive agent and the compaction density on the electronic conductance of the pole piece in the lithium ion battery pole piece. Based on the electrical conductivity of the sheet, researchers can further determine the optimal formula and process parameters in combination with the requirements for battery energy density and ion conductance.
4.References
1. IEST, "A New Method for Monitoring Electrode Stability and Uniformity", https://mp.weixin.qq.com/s/O3wwYuhkY3XspeDDE5qczQ.
2. Xu Jieru, Li Hong, et al. Conductivity measurement and analysis method in lithium battery research [J]. Energy Storage Science and Technology, 2018, 7(5) 926-955.
3. Hiroki Kondo et al. Influence of the Active Material on the Electronic Conductivity of the Positive Electrode in Lithium-Ion Batteries[J]. Journal of the Electrochemical Society, 2019,166 (8) A1285-A1290.
4. B.G. Westphal et al. Influence of high intensive dry mixing and calendering on relative electrode resistivity determined via an advanced two point approach[J]. Journal of Energy Storage 2017, 11, 76–85.
5. Rinaldo Raccichini, Alberto Varzi, Stefano Passerini and Bruno Scrosati,The role of graphene for electrochemical energy storage[J],Nature Materials, 2015 , 3, 14.
6. Wu Xiangkun, Zhan Qiushe, Zhang Lan, Zhang Suojiang. Microstructure optimization and controllable preparation technology progress of lithium battery pole piece [J]. Applied Chemistry, 35(9): 1076-1092.
7.Nobuhiro Ogihara,et al.Impedance Spectroscopy Characterization of Porous Electrodes under Different Electrode Thickness Using a Symmetric Cell for High Performance Lithium-Ion Batteries[J].The Journal of Physical Chemical C, 2015, 119(9):4612-4619.
