In-situ Analysis of the Volume and Thickness Swelling Behavior of the Pouch Cell
For lithium-ion batteries encapsulated with aluminum-plastic film or steel shell, due to the limitation of external space, the volume swelling during charging and discharging will cause different degrees of stress inside the battery, which will affect the battery capacity, rate, safety performance, etc. Therefore, controlling the lithium volume swelling of the ion battery is the key point to ensure the safety and reliability of the battery cell. Cell volume swelling is divided into reversible swelling and irreversible swelling. Among them, the reversible swelling comes from the structural swelling caused by the lithium ion de-intercalation process and the thermal swelling caused by the thermal effect of the battery, and the irreversible swelling comes from gas production or irreversible structural phase change 1-5。In this paper, from the two perspectives of cell volume and cell thickness, as shown in Figure 1 (a) and (b), the in-situ method is used to monitor the swelling change during charging and discharging and analyze the swelling behavior of the pouch cell.
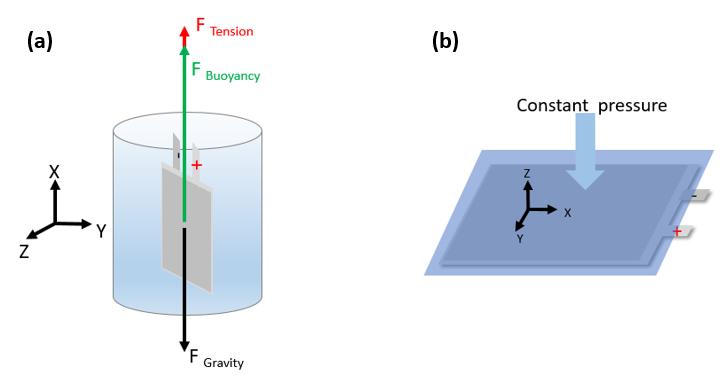
Figure 1. Test schematic: (a) Volume Test(b)Thickness Test
1.Experimental Equipment and Test Methods
1.1 Experimental Equipment
1.1.1 In-situ gas volume monitor, model GVM2200 (IEST), test the temperature range of 20 ℃ ~ 85 ℃, support dual-channel (2 batteries) synchronous test, the appearance of the device is shown in Figure 2.
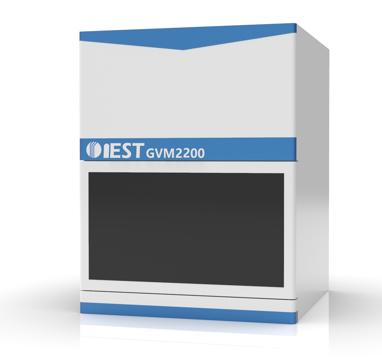
Figure 2. Appearance of GVM2200 Equipment
1.1.2 In-situ swelling analyzer, model SWE2110 (IEST), the appearance of the equipment is shown in Figure 3.
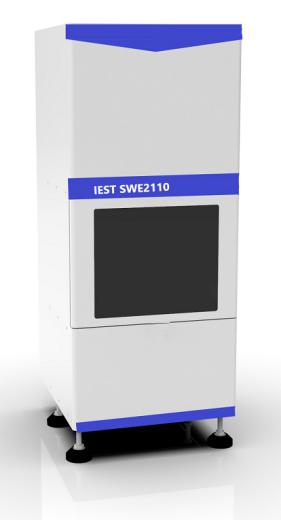
Figure 3. Appearance of SWE2110 Equipment
1.2 Test Process
1.2.1 Charge and Discharge Process: 25℃ Rest 5min; 1C CC to 4.2V, CV to 0.025C; rest 5min; 1C DC to 2.8V, analyze the swelling behavior of the same cell in two adjacent cycles.
1.2.2 Cell Volume Swelling Test: Measure the initial weight m0 of the cell, put the cell to be tested into the corresponding channel of the device, open the MISG software, set the cell number and sampling frequency parameters corresponding to each channel, and the software automatically reads the volume change and test Data such as temperature, current, voltage, and capacity.
1.2.3 Cell Thickness Swelling Test: Put the cell to be tested into the corresponding channel of the device, open the MISS software, set the cell number and sampling frequency parameters corresponding to each channel, and the software automatically reads the cell thickness, thickness change, test temperature, and current, Voltage, capacity and other data.
2. In-situ Analysis of the Swelling Behavior of Soft-pack Batteries
2.1 Cell swelling behavior during the whole charge and discharge process
Perform in-situ swelling analysis on the same cell's two continuous charging and discharging processes.
The cell design information and capacity information are shown in Table 1.
Table 1. Cell design information and capacity information
Cell Design System :NCM811/Graphite Cell Size :47*35*4mm³ | ||||
Capacity/Ah | CC | CV | DC | Coulombic Efficiency |
1st cycle | 0.5615 | 0.7001 | 0.6282 | 89.7% |
2nd cycle | 0.5231 | 0.6802 | 0.6064 | 89.1% |
Figure 4 (a) and (b) respectively show the volume change and thickness change of the cell during charging and discharging. During the constant current charging process, the volume and thickness of the battery cell increase; during the constant voltage process, both volume and thickness decrease; during the constant current discharge process, the volume change curve shows increase firstly and then decrease, while the thickness change curve first basically keep unchanged and then gradually decrease. The cell volume and thickness change percentage are basically the same, indicating that the deformation in the thickness direction is mainly caused by the de-intercalation of lithium during the charging and discharging process, which in turn shows the overall volume deformation.
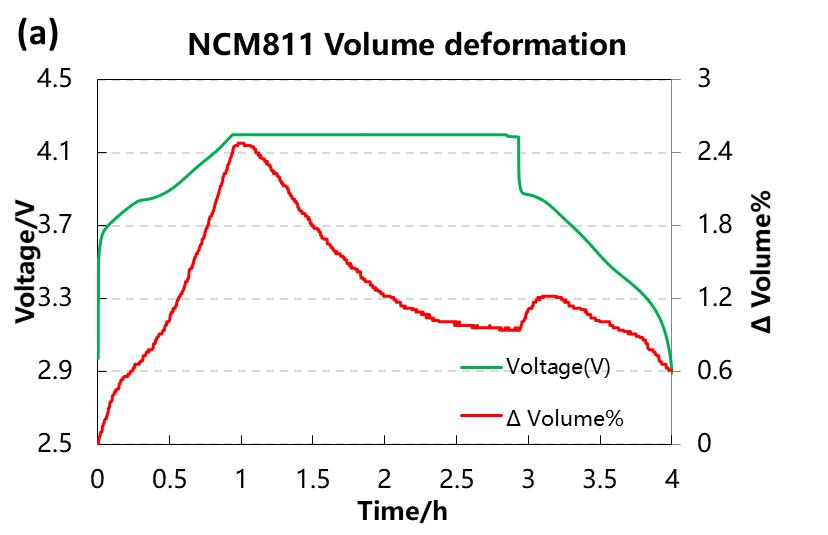
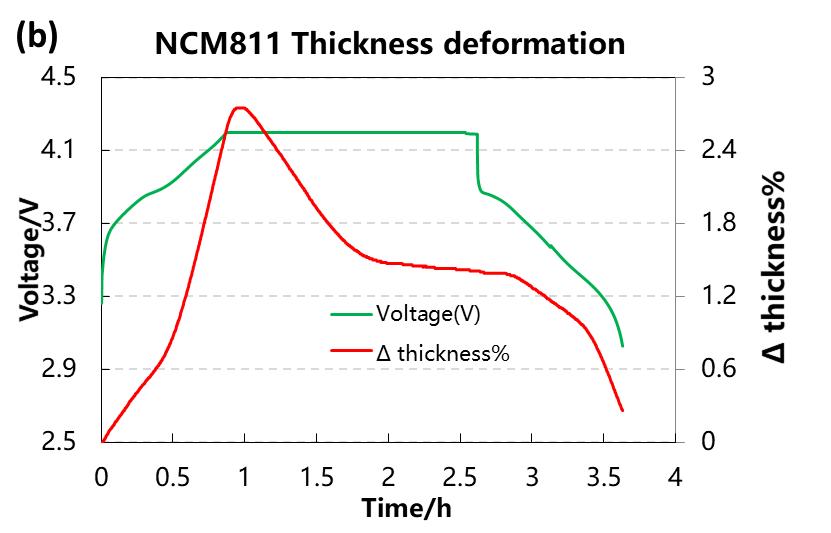
Figure 4. (a) Voltage and volume change during charge and discharge. (b) Voltage and thickness change during charge and discharge.
2. 2 Cell Swelling Behavior During Constant Current Charging
In the constant current charging process, the differential capacity curve, volume change and thickness change curve are shown in Figure 5 (a) and (b). The peak of the differential capacity curve corresponds to the phase change of the positive and negative electrode materials in the process of lithium extraction. At the peak voltage position, the slope of the volume and thickness change curve will also change accordingly.
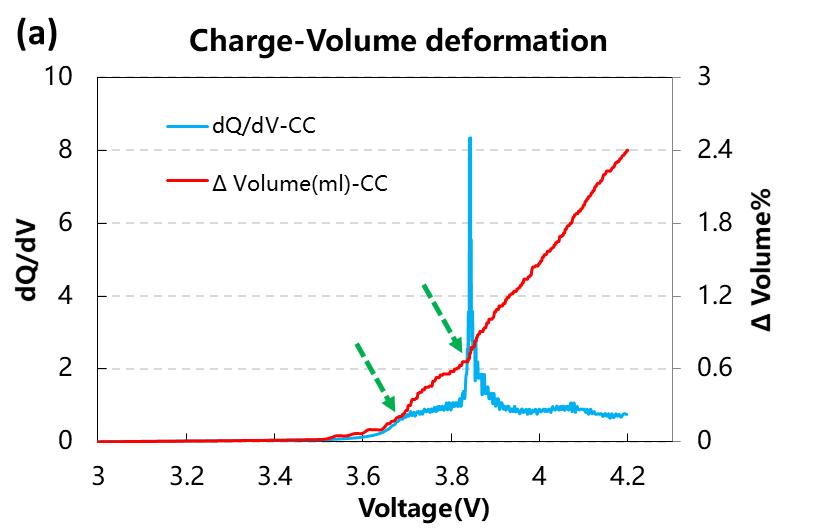
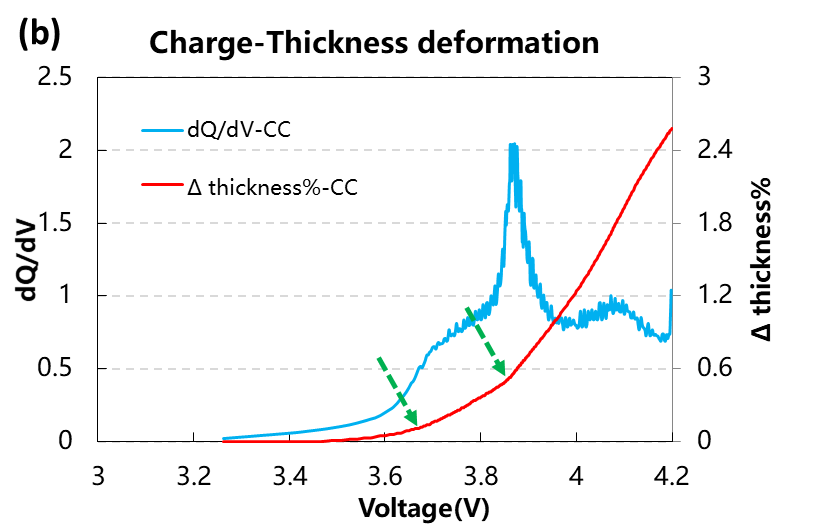
Figure 5. (a) Differential capacity and volume change during constant current charging. (b) Differential capacity and thickness change during constant current charging.
2.3 Cell Swelling Behavior During Constant Voltage Charging
In the constant voltage charging process, the cell current change curve and the volume and thickness change curve are shown in Figure 6 (a) and (b). During constant voltage charging, the current gradually decreases, the lithium concentration distribution between the graphite layers is gradually uniform5, the cell volume and thickness gradually decrease and become stable.
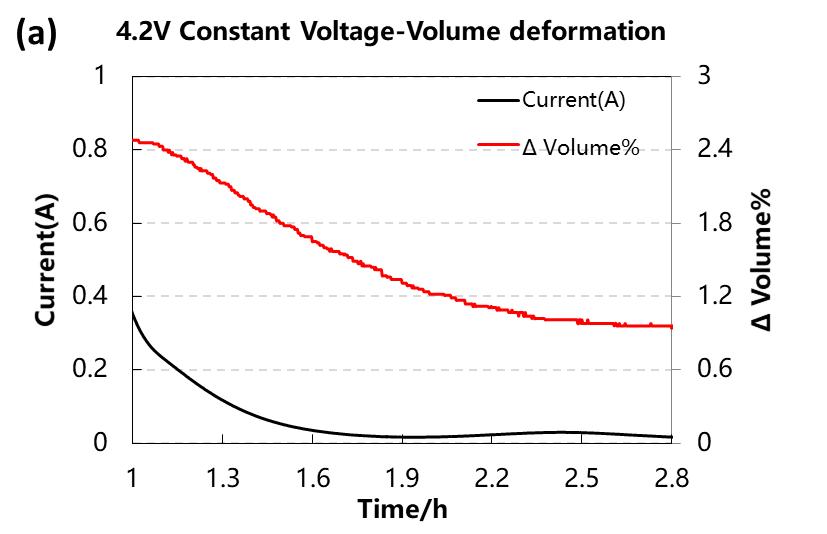
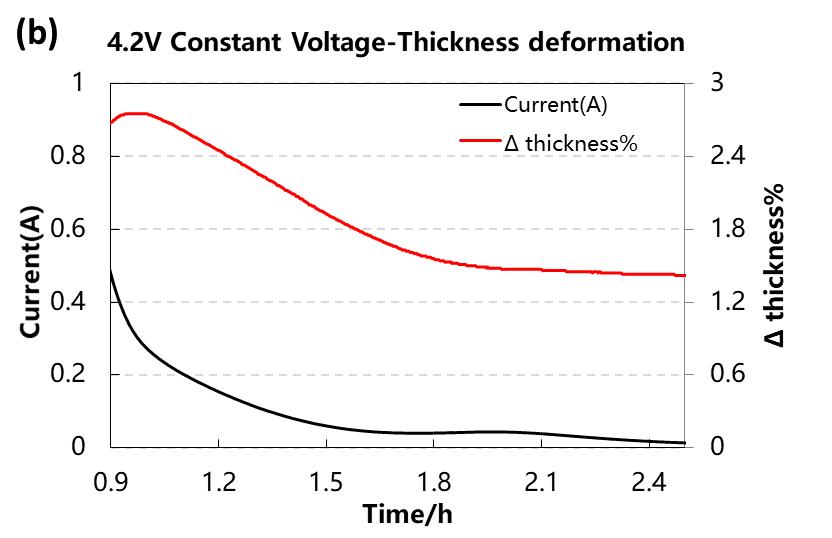
Figure 6. (a) Current and volume changes during constant voltage charging. (b) Current and thickness changes during constant voltage charging.
2.4 Cell Swelling Behavior During Constant Current Discharge
In the process of constant current discharge, the differential capacity curve and the volume and thickness change curve are shown in Figure 7 (a) and (b). At the beginning of the discharge, the volume of the battery cell expands by about 0.3%, which may be related to the Hexagonal 3→Hexagonal 2 phase transition caused by the insertion of lithium ions into the NCM material during discharge. The volume of the positive electrode material increases slightly, and the constant pressure of 15kg is used (~1MPa). The thickness of the battery cell is basically unchanged at the initial stage of discharge. Similar to the swelling behavior of the charging process, the peak position of the differential capacity curve during the discharge process will also correspond to the change of the slope of the volume and thickness curve. The volume and thickness changes during charging and discharging are not completely symmetrical. This is caused by the incomplete reversible phase change of the material during the charging and discharging process, which leads to a certain degree of irreversible swelling4.
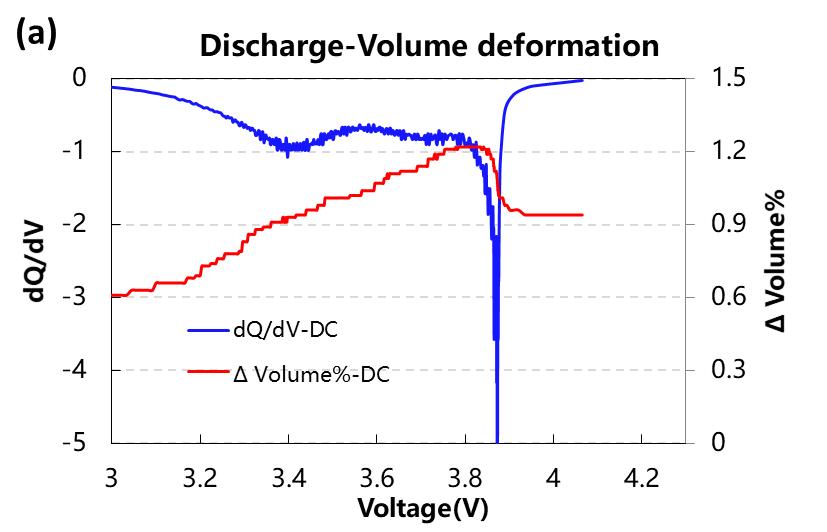
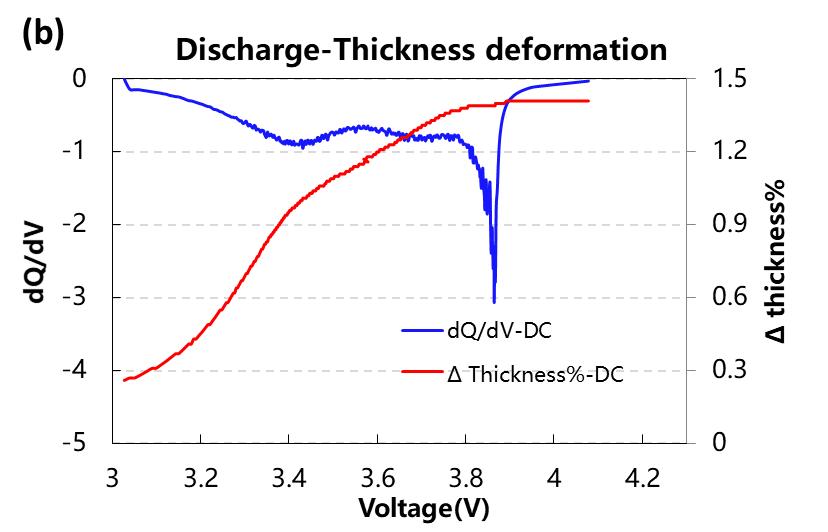
Figure 7. (a) Differential capacity and volume change during constant current discharge. (b) Differential capacity and thickness change during constant current discharge.
3.Summary
In this paper, an in-situ gas volume monitor (GVM) and an in-situ swelling analyzer (SWE) are used to analyze the volume and thickness swelling during the charging and discharging process of the pouch cell, which can characterize the reversible swelling and irreversible swelling in real time, and help developers from Analysis of cell swelling behavior in different dimensions.
4.Reference Materials
1. Ruihe Li, Minggao Ouyang et al. Volume Deformation of Large-Format Lithium Ion Batteries under Different Degradation Paths. Journal of The Electrochemical Society, 2019, 166 (16) A4106-A4114
2. Shiyao Zheng, Yong Yang et al. Correlation between long range and local structural changes in Ni-rich layered materials during charge and discharge process. J. Power Sources. 2019,412,336–343;
3. Y. Reynier, R. Yazami, B. Fultz. The entropy and enthalpy of lithium intercalation into graphite. Journal of Power Sources .2003, 119–121 850–855
4. Jan N. Reimers and J. R. Dahn. Electrochemical and In Situ X-Ray Diffraction Studies of Lithium Intercalation in LixCoO2. Journal of Electrochemical Society, 1992, 139, 8
5. Haifeng Dai, Chenchen Yu, Xuezhe Wei, Zechang Sun. State of charge estimation for lithium-ion pouch batteries based on stress measurement. Energy, 2017,129, 16.
