In-situ Analysis of Volume Changes of NCM811 Cells During High Temperature Cycling
As the nickel content of ternary materials increases, how to maintain structural stability is a major challenge. During the cycle, the ternary system battery cell will have a certain degree of volume change, which is mainly caused by two reasons: one is the expansion of the material structure 1-3, including the expansion of graphite de-intercalation of lithium, and the ternary material H1/H2/H3 Expansion of phase change, cracks caused by stress, etc. The second is gas 4 produced by electrolyte side reactions. For example, C2H4 and H2 are generated in the negative electrode during SEI film formation, and O2, CO, and CO2 are generated during the ternary phase change, as shown in Figures 1 and 2. This paper uses an in-situ volume monitor to analyze the volume changes of two different electrolyte systems of NCM811 system cells during high temperature cycling, and provides a method for R&D to accurately evaluate electrolyte performance.
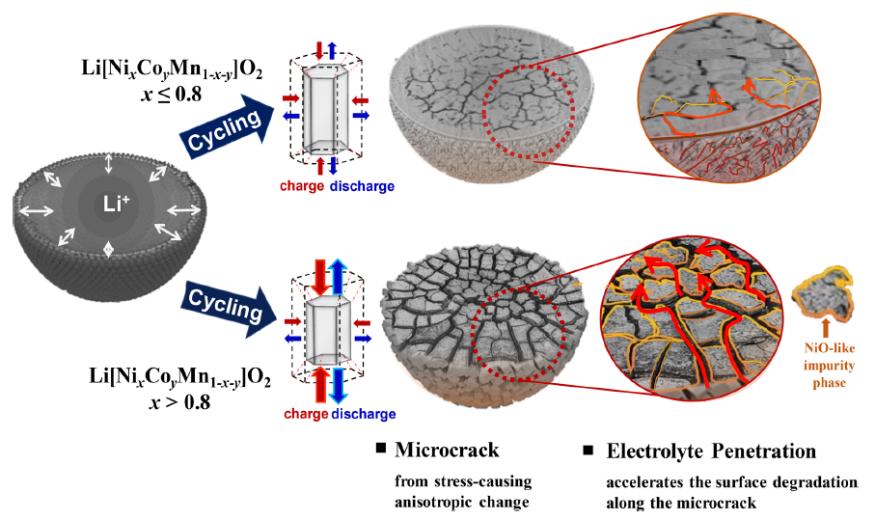
Figure 1. Schematic diagram of capacity loss of ternary material Li[NixCoyMn1−x−y]O21
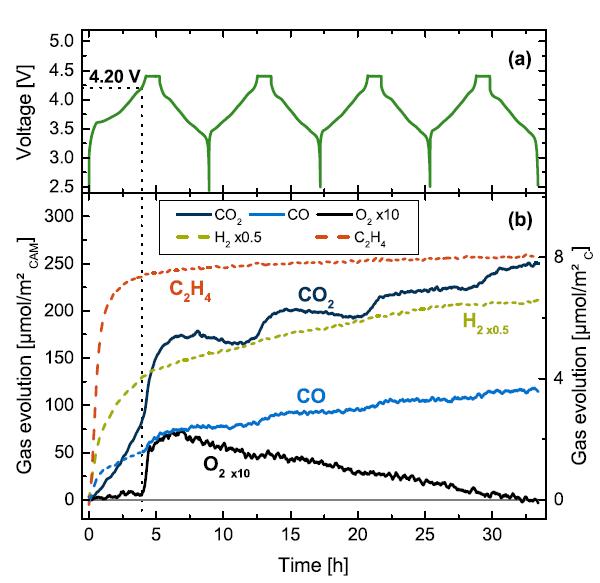
Figure 2. NMC811-Graphite charge and discharge curve and OEMS gas production curve 4.
1.Experimental Equipment and Test Methods
1.Experimental Equipment: Model GVM2200 (IEST), the test temperature range is 20℃~85℃ and it supports dual-channel (2 batteries) simultaneous testing.
The Appearance of the Equipment is Shown in Figure 3.

Figure 3. Appearance of GVM2200 Equipment
2.Testing Method
2.1 Test Temperature: 60℃
2.2 Charge and Discharge Process: Rest 5min; 0.5C CC to 4.2V, CV to 0.025C; rest 5min; 0.5C DC to 2.8V.
2.3 In-situ Volume Monitoring: Weigh the cell initially m0, put the cell to be tested into the corresponding channel of the device, start the MISG software, set the corresponding cell number and sampling frequency parameter of each channel, the software automatically reads the volume change, Test data such as temperature, current, voltage and capacity.
In-situ Analysis of NCM811 Cell High Temperature Cycle Volume Change
The 60℃ cycle volume monitoring data of two groups of NCM811 pouch cell batteries are shown in Figure 4. Comparing the volume changes, it can be seen that the batteries of group B begin to increase abnormally after about 5 cycles, while the volume of batteries of group A increases slowly, which shows that the electrolyte system corresponding to the battery cells of group B is prone to side reactions and gas generation, which leads to abnormal increase in the volume of the batteries.
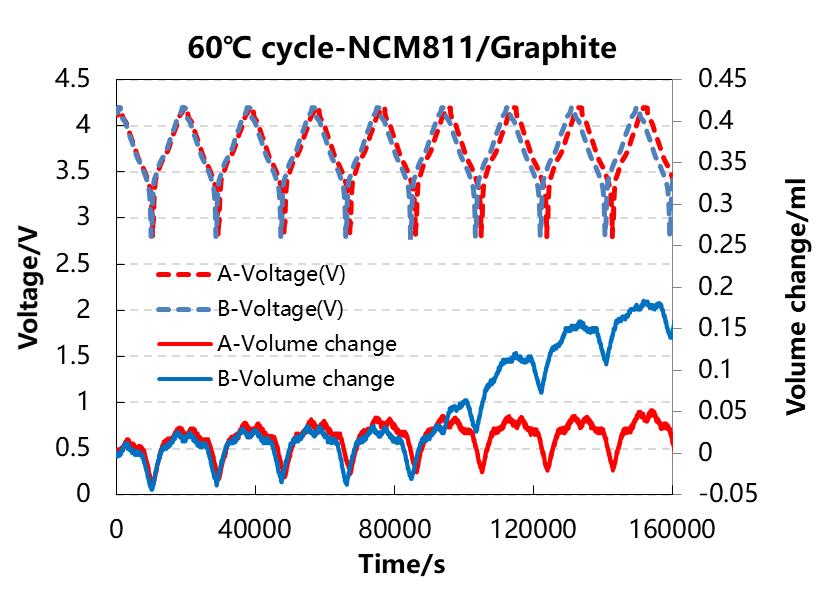
Figure 4. NMC811-Graphite battery charge and discharge curve and volume change curve
Further analysis is made on the charge-discharge and volume change curves of group B batteries. As shown in Figure 5, the corresponding capacity and cell volume change curves for different cycles of full discharge. The discharge capacity starts to decrease significantly at the 4th circle, and the cell volume change increases significantly from the 4th circle, which shows that the increasing of cell volume is related to the capacity decay, which may be due to the side reaction consuming active lithium which leads to the capacity decay, and the gas produced by the side reaction causes the cell volume to increase.
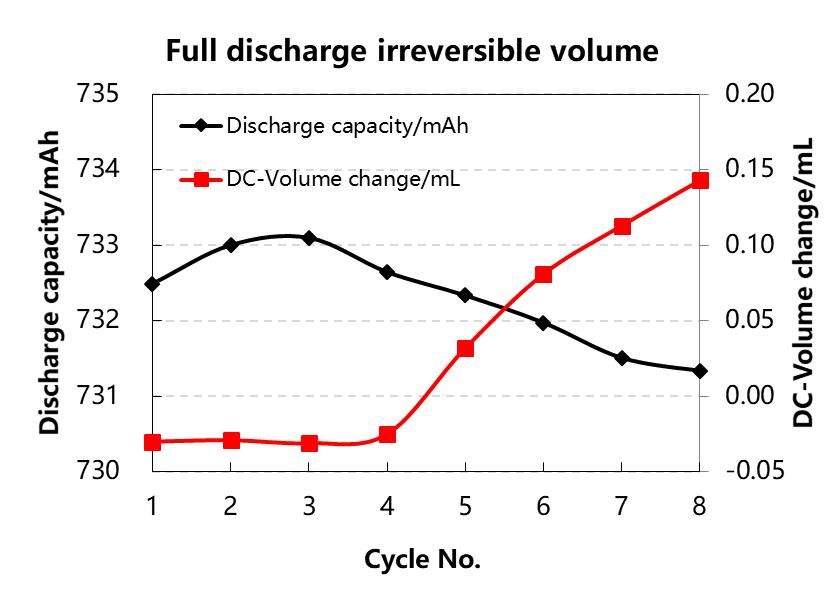
Figure 5. Discharge capacity and volume change curve at full discharge with cycle change
Continue to analyze the charge and discharge curves and relative volume change curves of the first and eighth cycles of the B group of batteries. As shown in Figure 6, the difference between the charge and discharge curves of the two cycles is not obvious, but the volume change is significant. The eighth cycle volume change of the battery cell during the discharge process is significantly greater than that of the first turn. This is due to the gas production superimposed on the volume change caused by the structural phase change, which causes the total volume of the battery cell to increase.
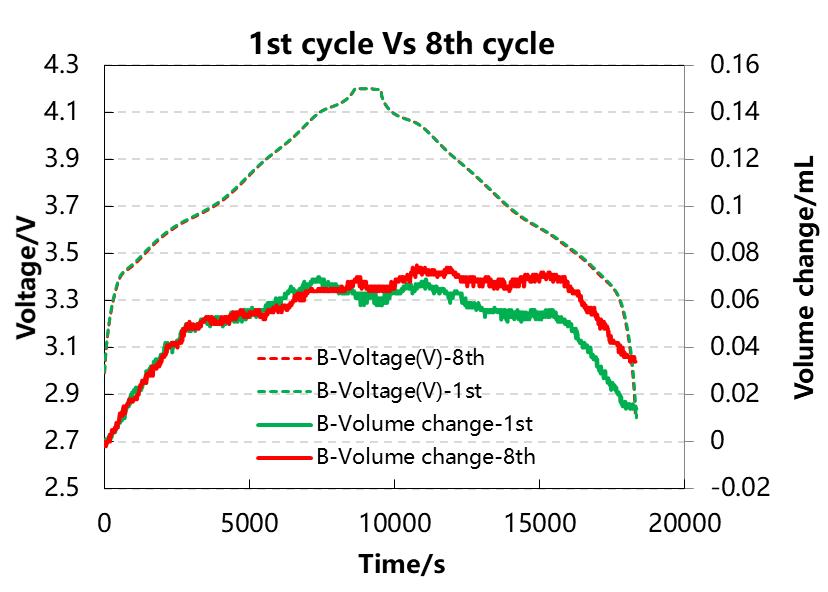
Figure 6. The charge, discharge and volume change curves of the first and eighth cycles of the B group batteries
Analyze the differential capacity curve of group B cells, as shown in Figure 7 (a) and (b), the 4 peaks during the charging process correspond to 4: peak1 is C6→LiCx, peak 2 is Hexagonal 1→Monoclinic, Peak 3 is Monoclinic→Hexagonal 2, peak 4 is Hexagonal 2→Hexagonal 3. According to the volume change curve corresponding to each peak, it can be seen that the lithium intercalation process of graphite will cause a substantial increase in volume, and the phase change between H1/M/H2/H3 of ternary materials will sometimes cause the volume of the positive electrode material to shrink, thereby slowing down the increase in the volume of the overall battery cell. As the cycle increases, the gap between the volume change curves corresponding to charging and discharging increases, which also shows that the irreversible volume expansion gradually increases.
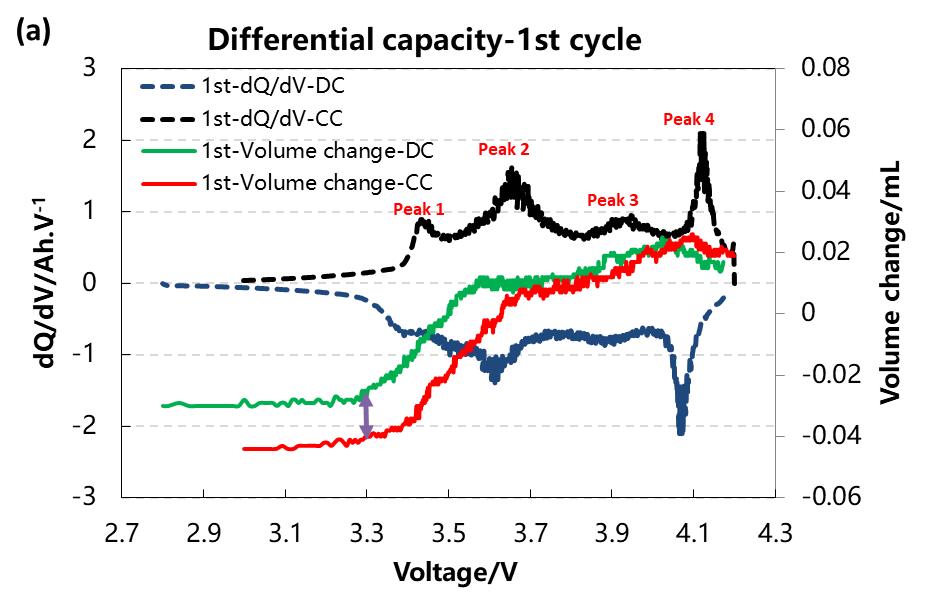
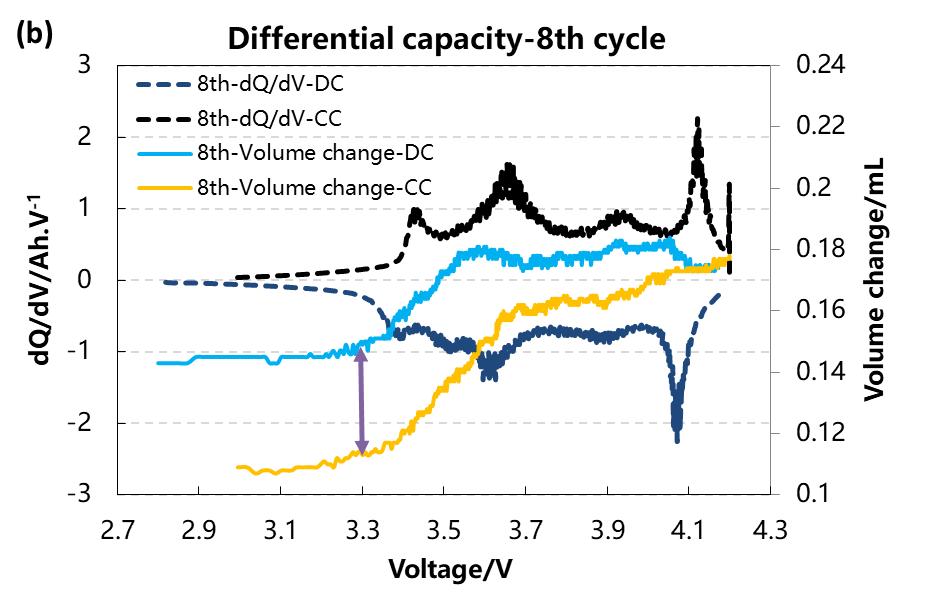
Figure 7.(a) and (b) differential capacity and volume change curves of the first and eighth cycles of the B group cells
Summary
In this paper, a temperature-controllable dual-channel in-situ volume monitor is used to analyze the volume changes of NCM811/Graphite cells with two different electrolyte systems during high-temperature cycling, which can intuitively evaluate the gas production of the two electrolyte systems In addition, the volume change corresponding to the phase change of the material in the process of de-intercalating lithium can be seen, which helps developers to in-depth analysis of the material and electrolyte performance from the mechanism.
Reference Materials
1.Hoon-Hee Ryu, Kang-Joon Park, Chong S. Yoon, and Yang-Kook Sun. Capacity Fading of Ni-Rich Li[NixCoyMn1−x−y]O2 (0.6 ≤ x ≤ 0.95)Cathodes for High-Energy Density Lithium-Ion Batteries: Bulk or Surface Degradation. Chem. Mater. 2018, 30, 1155−1163;
2.Shiyao Zheng, Yong Yang et al. Correlation between long range and local structural changes in Ni-rich layered materials during charge and discharge process. J. Power Sources. 2019,412,336–343;
3.Aleksandr O. Kondrakov et al. Anisotropic Lattice Strain and Mechanical Degradation of High- and Low-Nickel NCM Cathode Materials for Li-Ion Batteries. J. Phys. Chem. C 2017, 121, 3286−3294
4.Roland Jung et al. Oxygen Release and Its Effect on the Cycling Stability of LiNixMnyCozO2(NMC) Cathode Materials for Li-Ion Batteries. J. Electrochem. Soc. 2017, 164 A1361
