Compression and Conductivity Analysis of Different Particle Size Distribution for LCO Materials
Lithium-ion battery raw materials mainly include cathode materials, cathode materials, fluid collection, electrolyte and diaphragm. Positive and negative electrode materials are usually micron-grade powder materials, among which the common lithium-ion battery cathode powder materials are layered lithium cobalt oxide, olivine structure lithium iron phosphate, spinel lithium manganese oxide structure, and layered nickel-cobalt-manganese ternary materials (hereinafter referred to as NCM). Where, if any, lithium cobalt oxide (LiCoO2, LCO) occupies a dominant position in class 3C (computer, communication and consumer) based electronic batteries, which has the advantages of high energy density, high voltage platform, stable discharge, and simple production process. At present, the demand for lightweight and intelligent portable electronic products for a longer time has promoted the development of LCO batteries and further improved the energy density. As shown in Figure 1, the development roadmap of lithium cobalt acid batteries shows.
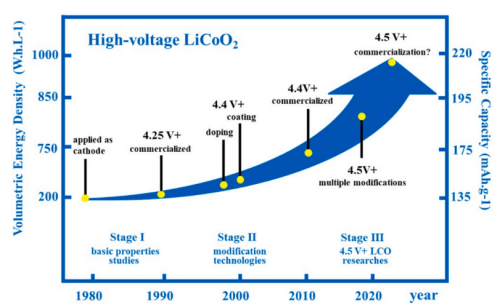
Figure 1. LCO-Graphite full-cell development Roadmap【1】
Lithium ion battery production process in pole plate production process is the most important link, Pole sheet roller pressure is also an important process section in the process of pole sheet production, Pole sheet roller pressure is generally arranged after the coating and drying process, Prior to the film-cutting process, After the pole sheet enters the roller press, Under the action of the force, Flow, rearrangement and embedding of active particles in the polar sheet, The gap between the particles is altered, The pole sheet roller pressing process is the rearrangement and compaction process of the powder, This paper is mainly based on four different types of LCO powder materials, Test the resistivity, compaction density and compression properties of the powder under different pressures, In combination with SEM testing, The particle size, morphology, density and compression properties of LCO powder materials were analyzed.
1.Test Method
1.1 SEM Morphology Test of the Four Materials.
1.2 The Conductivity, compaction density and compression performance are tested by PRCD3100 (IEST) for the four LCO materials. The test equipment is as shown in Figure 2.
Test Parameters: Applied pressure range of 10-200MPa, interval of 20MPa, pressure holding for 10s;
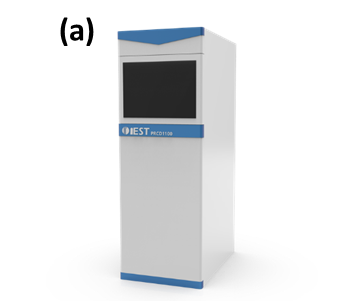 | 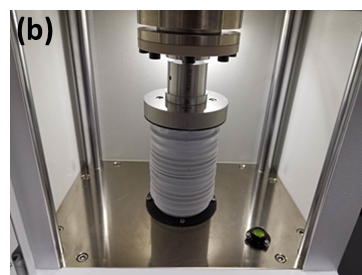 |
Figure 2. (a) PRCD3100 Appearance Diagram; (b) PRCD3100 Structure Diagram
2.Test Results
2.1 SEM Test Results
The four LCO powder materials were tested without pressure using SEM, Figure 3 shows the results of the SEM tests for four materials: LCO-1, LCO-2, L CO-3, and LCO-4, It can be seen from the figure that the particle distribution and particle size of the four materials are obviously different, Among them, LCO-1 contains samples with multiple grain sizes in the range of about 30m-5m, LCO-2 contains powder in the range of approximately 15m-5m, The LCO-3 sample contained powder in the range of approximately 45m-10m, LCO-4 is mainly a small particle size of about 5 m; The difference in particle size distribution directly affects the filling effect of the powder during compression, It is closely connected to the compaction density, electronic conductivity and compression properties between the materials.
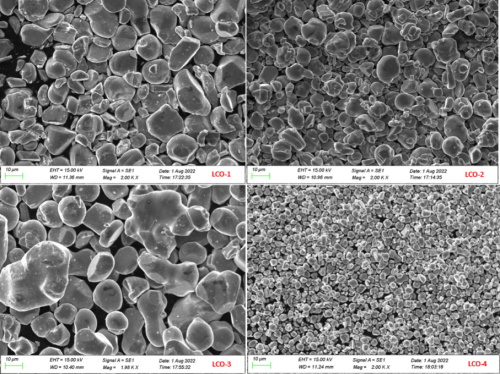
Figure 3. The SEM topography of the four LCO materials
2.2 Compression Performance Test Results
The compression performance of the powder material is related to the particle shape, particle size and distribution. Under the pressure effect, the overall powder deformation is the main irreversible deformation; the elastic deformation of the particles and the stress. When the pressure exceeds the yield strength of the powder material, it is also irreversible deformation. In fact, the process of powder particle compression is multigravity, and stress is also a process of comprehensive change.
Table 1.Summary of Shape Variables Data for the Four LCO Materials
 |
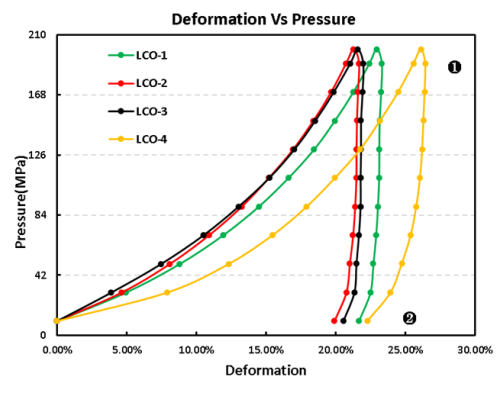 |
Figure 4. Stress and strain curves during the pressurized pressure relief of the four LCO materials
In this experiment, when the pressure reaches 200MP a, the pressure was gradually unloaded to obtain the stress and strain curves of the four LCO materials, as shown in Figure 4. The reversible deformation is also calculated as the difference between the maximum deformation (shown in part ❶) and the irreversible deformation (shown in part ❷), The specific data are shown in Table 1, It can be seen from the table that its reversible shape-like variable size, LCO-4> LCO-2> LCO-1> LCO-3, Comparative analysis combined with the SEM test results revealed that, For the particle size distribution of the four materials, The proportion of small-size particles also showed a trend of LCO-4> LCO-2> LCO-1> LCO-3, The comprehensive analysis may be that for the same material, When the particle size is small, the material has more contact area, More vulnerable to the force of elastic reversible deformation; To further identify this possibility, Analysed from the perspective of sampling volume and multiple experiments with different devices, The reversible deformation trend of all the four materials was LCO-4> LCO-2> LCO-1> LCO-3; For the contrast of the maximum deformation and irreversible deformation of the four materials, Different sampling sizes and test conditions will vary, This may be related to sampling differences and differences in filling effect.
3.2 Compaction Density & Electrical Conductivity Test Results
Powder material research shows that for the same material, single particle size, similar geometry of powder, large particle size will lead to small contact area, small interaction between particles (mechanical entanglement and friction), good mobility, the most easy to form close accumulation state, thus filling density, small porosity, under pressure, the particle gap occupy volume is small, it is easier to get relatively large compaction density. However, the actual powder has an actual continuous particle size distribution, which directly affects the filling effect. Powder samples with different particle size distribution can flow and rearrange under pressure, and the powder with large particle size can form more voids, while small particles can be filled into the gap, resulting in large compaction density and small void ratio.
Figure 5 shows the results of the compaction density determination of the four LCO materials, where the compaction density size contrasts with LCO-3> LCO> 1> LCO-2> LCO-4. Combined with the results of the S EM test found, Compared to the LCO-4 sample with a single particle size and smaller particles, The other three samples with a relatively large particle size and a multiple particle size distribution all have a relatively high compaction density, This indicates that the interaction force between the small particles is relatively large, Difficult flow rearrangement of particles, Form a higher porosity, Low compaction density; Comparing the three materials: LCO-1, LCO-2, and LCO-3, Particle size (LCO-3> LCO-1> LCO-2) and its distribution difference may also be one of the key factors for the difference in compaction density, Flders with wide particle size are more likely to form close packing, Small powders fill the gap between large particles, The final compaction density is higher. If the deformation of the particles themselves is not considered first, the compaction process of the powder particles is the process in which the powder the most densely accumulates from the loose state under pressure.
According to the most compact packing principle, when the spherical particles with radius R are packing in the most compact way, all the particles contact with each other, the theoretical porosity formed between the particles is 25.94%, and the pores between primary particles with radius R can fill the secondary particle radius is 0.414R. After all the pores are filled with secondary particles, the porosity is 20.70%. The maximum particle radius that can be refilled in the pore is 0.225R, cubic particles, 0.177R, and 0.116R, corresponding to a theoretical porosity of 19%, 15.8%, and 14.9%.
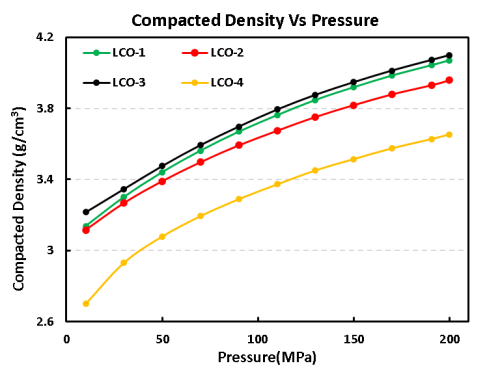
Figure 5. Compaction density test results for the four LCO materials
For the electronic conductivity of powder material, more connectivity and contact between powder particles, for most LCO materials, and the connection between powder particles and contact with the particle size and size distribution is also related, as mentioned in compaction density analysis, for the same particle size powder samples prefer point contact, the overall contact surface, smaller particles are surface contact; the same filling effect, can also affect the change of electrical conductivity.
Figure 6 shows the electrical conductivity test results of four LCO powder materials, The resistivity comparison results showed that LCO-1 has the best conductivity, The LCO-3 has the worst electrical conductivity, LCO-2 and LCO-2 under small pressure of LCO-2 and LCO-4, LCO-4 <LCO-2 under high pressure, Excluding the influence of differences in electrical conductivity of powder particles of different particle sizes, This difference may be mainly due to the different particle size distribution, on the whole, Wide particle-size distribution of the conductive LCO-1 samples, Can achieve a large degree of filling, The overall contact between the sample particles was better, Best electrical conductivity.
However, for the most conductive LCO-3 samples with the worst electrical conductivity, they have a large overall particle size and a narrow particle size distribution, and the overall contact with particles is poor, thus causing poor electronic conductivity. Similarly, for LCO-2 and LCO-4 samples, under low pressure, mainly due to the contact between sample particles, the overall size of LCO-4 samples showed good conductivity, and with the increase of the pressure, LCO-2 particles have filling effect, realize small particles between large particles, and the conductivity is greater than LCO-4, but the overall difference is not big.
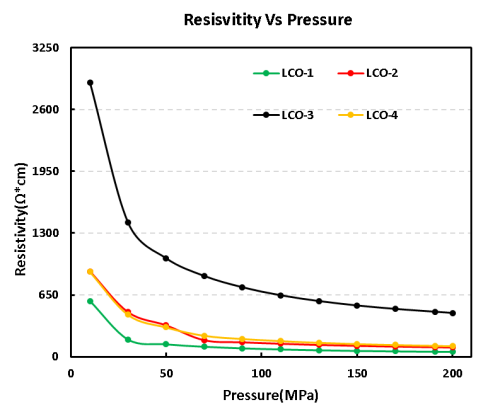
Figure 6. Electrical conductivity test curves of the four LCO materials
Sum Up
In this paper, PRCD3100 test the conductivity, compaction density and compression performance of four kinds of LCO materials, combined with the SEM particle size distribution difference of materials, preliminarily evaluated the possible connection between particle size distribution difference and material conductivity, compaction and compression performance, provides a new idea and direction for material difference analysis and evaluation.
Reference Documentation
[1] Kai W , Jw A , Yx A , et al.Recent advances and historical developments of high voltage lithium cobalt oxide materials for rechargeable Li-ion batteries[J].Journal of Power Sources, 460.
[2] Park M , Zhang X , Chung M , et al.A review of conduction phenomena in Li-ion batteries[J].Journal of Power Sources, 2010, 195(24):7904-7929.
[3] Yang Shaobin, Liang Zheng. Manufacturing process principle and application of lithium-ion battery.
