Effect of Crystal Structure and Electronic Properties on Lithium Storage Performance of Artificial Graphite
Article Overview
In the field of lithium battery research, reported studies have shown that the capacity of artificial graphite is closely related to its conductivity and crystal structure, but there has been no detailed study of the relationship between electronic or lithium-ion conductivity and crystal structure. This work attempts to build a bridge between conductivity and crystal structure to deeply explore their impact on lithium storage performance.
Graphite is considered a semiconductor or semi-metal with zero activation energy, where the La value represents the base plane parallel to the graphene layer, and the Lc value represents the edge position of the end face of the graphite crystal. The sizes of La and Lc change with the degree of graphitization of the carbon material. Generally, the greater the degree of graphitization, the larger the values of La and Lc. Compared with the basal surface, the edge position has higher Li+ insertion/extraction activity, resulting in higher rate performance. Graphite with high La shows higher capacity. This paper combines a series of graphites with different crystal structures to design a concise method to qualitatively evaluate the conductivity of lithium ions, and reveals the lithium storage mechanism of lithium ions from the perspective of solid-state theory. Electrical conductivity analysis shows that graphite with longer crystal faces and fewer stacked layers has higher electronic conductivity (σe). On the other hand, lower initial charge/discharge voltage indicates that graphite with lower La and higher Lc maintains higher lithium-ion conductivity (σLi).
The conductivity of graphite mainly depends on σe, while the conductivity of lithium-embedded graphite is determined by both σe and σLi. At lower charge and discharge rates, Li+ has enough time to be embedded in the graphite layer, so that the specific capacity of graphite is mainly determined by σe. However, as the charge and discharge rate increases, the insertion/extraction of Li+ becomes more difficult, making σLi the main factor influencing the specific capacity of graphite. Therefore, graphite with longer crystal faces and fewer stacked layers has a higher specific capacity under slow charge and discharge rates, graphite with shorter crystal faces and more stacked layers has a relatively low specific capacity under fast charge and discharge rates.
Sample Preparation and Test
1.Preparation of three types of petroleum coke using autoclave thermal cooking method.
2.Petroleum coke undergoes heat treatment (1300°C) and graphitization (2800°C) to prepare corresponding artificial graphite.
3.Test Items: Crystal structure analysis, material element analysis, graphite morphology and microstructure analysis, powder conductivity & compaction density analysis, electrochemical performance analysis, etc.
Result Analysis
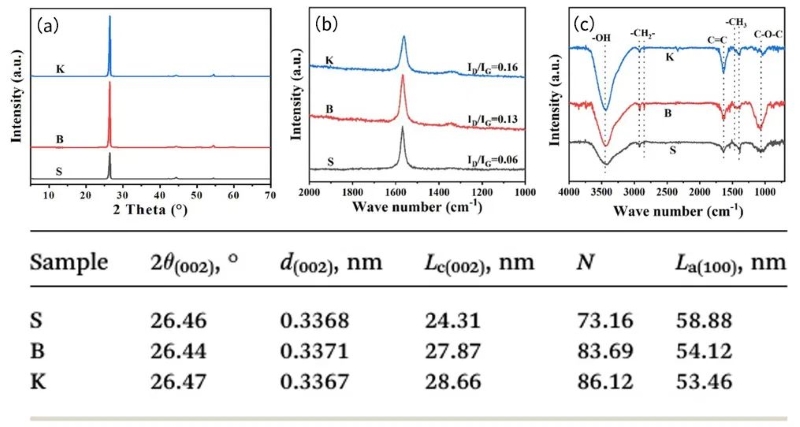
Combining the XRD and characterization data in Figure 1, the average crystallite height Lc (002) and the average graphite layer stacking number N of graphite sample K are the largest, and the Lc (002) and N values of graphite sample S are the smallest. Graphite sample S has the largest value of average crystallite length La (100), while graphite sample K has the smallest value. This shows that K graphite crystallites have a larger stacking height and a shorter length. It can be seen from the Raman diagram that in these samples, the ratio of peak intensity ID/IG shows an increasing trend of S<B<K, indicating that the disordered state of K in the graphite sample is relatively high. Combined with the XRD results, it can be concluded that graphite with more "edge sites" has more defects.
In the FT-IR in Figure 1, the peak intensity of graphite K at 3430cm−1 is stronger than the other two samples, indicating that the edge position of graphite K can accommodate more -OH groups. The peak at 1636 cm-1 is formed by the C=C unsaturated structure of the aromatic ring. The peak intensity of graphite K at 1636 cm-1 is also the highest among these graphite samples, which indicates that the microcrystalline structure of graphite K exposes more unconnected hexagonal carbon rings. Combining the XRD, Raman and FT-IR characterization results, it can be inferred that the graphite K microcrystals have the characteristics of higher layering, shorter length parallel to the graphite layer, and more edge sites or defects, these edge sites or defect surfaces are rich in -OH or -COOH functional groups converted from adsorption of O2 or H2O.
Figure 1. Details of XRD, Raman spectra, FT-IR spectra and XRD characterization of three graphite samples
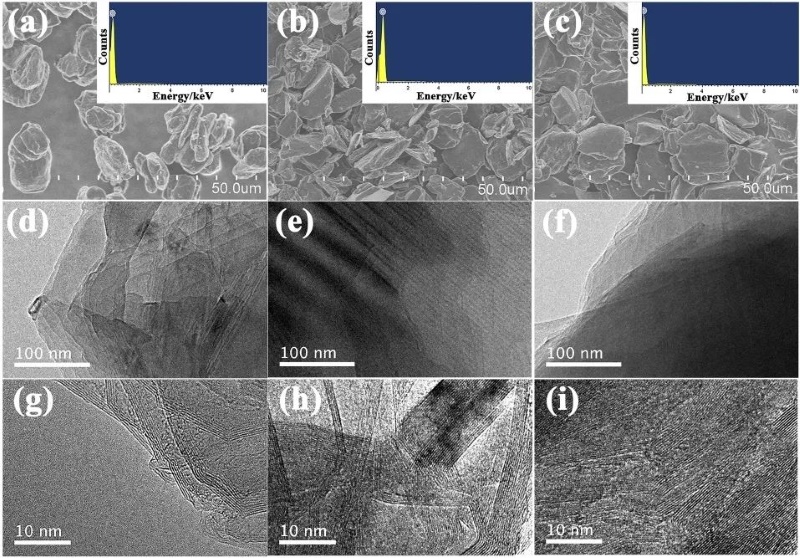
Combining SEM and TEM images, the three samples showed typical characteristics of graphite. There was no obvious difference in the SEM morphology of the three samples. They were all composed of irregular micron-sized particles with relatively smooth surfaces and similar particle size distributions (Figure 2a~c). The corresponding EDS analysis shows that only the C peak can be shown in the figure, indicating that carbon can be 100% detected, while other elements are in trace amounts, as shown in the insets of Figure 2a~c. In addition, the TEM and HR-TEM images of these samples are shown in Figure 2d~i, and the obvious layered structure and lattice stripes can be clearly seen, indicating that these samples have a high degree of graphitization after high temperature treatment.
Figure 2. SEM images and EDS mapping of S (a), B (b) and K (c) (inset); TEM and HRTEM images of S (d and g), B (e and h), and K (f and i)
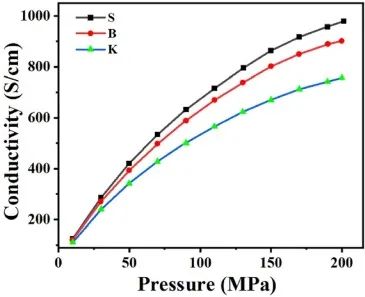
Electronic conductivity can reflect the obstruction to electron movement. The initial discharge specific capacity is equivalent to the instantaneous current intensity discharged from graphite, which is strongly affected by the electronic conductivity of graphite in a constant voltage range. By testing the electronic conductivity of graphite under different pressures, the relationship between the graphite microcrystalline structure and its electronic properties was studied. As shown in Figure 3, the electronic conductivity of the graphite samples increases with increasing applied test pressure. In the given graphite sample, the electronic conductivity shows an increasing trend in the following direction: K<B<S, which is simultaneously in the same order as the crystallite length La and in the opposite order as the ratio ID/IG.
Figure 3. Electrical conductivity test of three graphite samples
The charge/discharge curves of the three samples are shown in Figure 4a~c, and their reversible capacities all show an increasing trend of S>B>K, which is consistent with the changing trend of the La value in the samples. As a result, longer graphite crystallites have more intercalation sites for lithium storage. Figure 4d shows the rate performance of the three samples. Sample S showed higher capacity at low rates, while the capacity dropped sharply at 2C. In contrast, sample K exhibits the largest reversible capacity at 2C. For samples B and S, B exhibits a larger reversible capacity than S under 2C conditions. Due to fewer edge sites, sample S maintains slower electrode kinetics, which means that charge transfer is difficult at higher current densities, resulting in the reversible capacity of sample S being lower than that of sample B and sample K at high current densities. Based on this result and the study of the La and Lc parameters of graphite, it is shown that graphite with a larger parameter Lc value has a larger reversible capacity under high-rate charge/discharge conditions. This kind of microcrystalline exposes many edge positions that are conducive to Li+ intercalation and deintercalation, thus improving the rate performance of graphite. It can be seen from Figure 4e and f that the initial discharge voltage of the three samples decreases with the increase of current density.
On the contrary, the initial charge voltage increases with the increase of current density. By comparison, the initial discharge voltage and initial charge voltage of sample K are the lowest among the three samples, which indicates that the intercalation/extraction of Li+ may be easier than other samples because the polarization is smaller. Crystallites with higher stacking number and shorter length can not only provide more edge positions for Li+ insertion/extraction, but also shorten the diffusion path of Li+, which is beneficial to improving rate performance. Therefore, low Lc value and high La value is beneficial to the reversible capacity of graphite at low current density, while high Lc value and low La value are beneficial to the reversible capacity of graphite at high current density (improving rate performance).
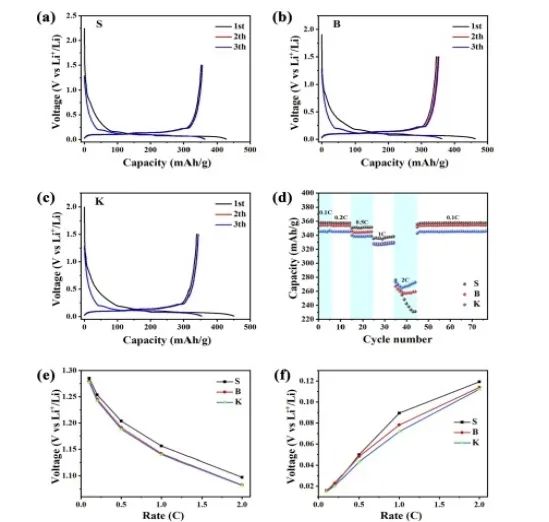
Figure 4. Charge-discharge curves of S (a), B (b), and K (c) at 0.1Ag−1; rate performance of lithium batteries of three samples at different current densities. (d); Initial discharge voltage of lithium battery at different current densitiese) and the initial charging voltage (f).
Conclusion
By analyzing the changes in the initial charge and discharge voltage under different current densities and combining the crystal structure and electronic conductivity of graphite, the article clarifies the specific capacity mechanism of graphite at different charge and discharge rates from the perspective of solid-state theory. The layer length (high La content) is beneficial to increasing the conductivity of lithium ions, while the accumulation of microcrystalline layers (high Lc content) is beneficial to improving the conductivity of lithium ions. The capacity of graphite is determined by the combination of σe and σLi. At lower current densities, Li+ has sufficient time to embed into the graphite layer, so that the specific capacity of graphite is mainly determined by σe. However, as the charge and discharge rate increases, the insertion/extraction of Li+ becomes more difficult, making σLi the main factor influencing the specific capacity of graphite. The fewer the stacked layers and the longer the length of graphite, the higher the reversible capacity. Therefore, it is reasonable to conclude that graphite with lower stacking layer (Lc) and longer crystallite length (La) can improve the specific capacity, and higher Lc and shorter crystallite length (La) are beneficial to improving rate performance.
Original Document
Zhiwei Liu, Yang Shi, Qinghe Yang, Haiping Shen, Qiming Fan and Hong Nie* Effects of crystal structure and electronic properties on lithium storage performance of artificial graphite. RSC Adv.,2023, 13, 29923–29930 DOI: 10.1039/d3ra05785b
Recommendations for IEST Related Testing Equipment
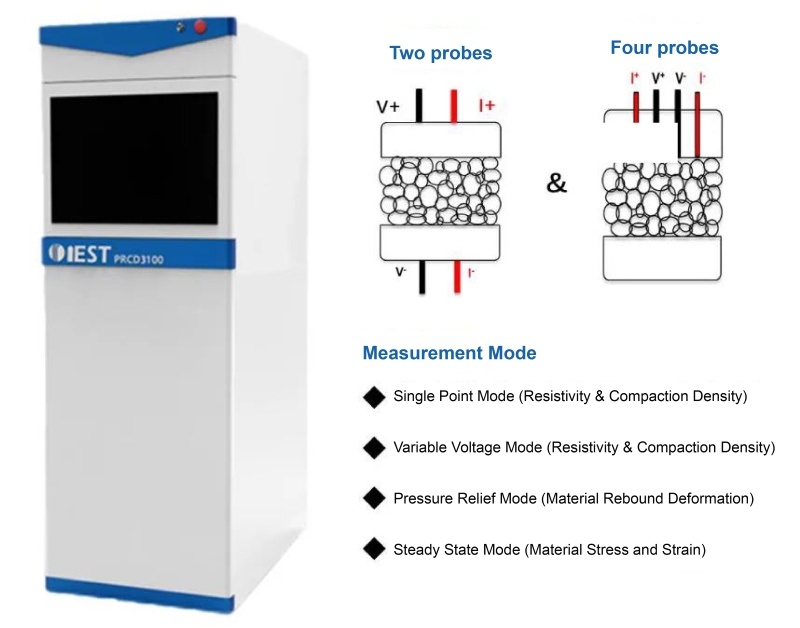
The PRCD series powder resistivity & compaction density meter (IEST) can effectively test the resistivity & compaction density of powder materials. This series of equipment has been widely used in lithium battery material companies, battery cell companies and university scientific research. it can realize multi-scenario applications such as material batch stability monitoring, incoming material monitoring, and process development.

