Analysis of Electrical Conductivity and Compression Properties of Hard Carbon and Graphite Materials
With the rapid development of the new energy industry, the market demand for lithium-ion batteries is also increasing. Due to the raw material resource limitations and cost problems of lithium-ion batteries, sodium-ion batteries have gradually attracted the attention of many researchers. Among them, the most commonly used graphite anode in lithium ion batteries. When used in sodium ion batteries, due to thermodynamic reasons, sodium ion is difficult to embed between graphite layers, and it is not easy to form stable intercalation compounds with carbon. Therefore, it is difficult for sodium ion batteries to use graphite as a cathode material1And no qualitative hard carbon material has a very good sodium storage performance (specific capacity of 300mAh / g) and a low sodium storage potential (platform voltage is about 0.1V), is the most promising sodium ion battery cathode material. In addition to the well-known differences in structure, morphology, and electrochemical curves between graphite and hard-carbon materials, how different are the conductivity, compaction density, and rebound properties of powders? In this paper, two commonly used graphite and hard carbon powders are selected to compare the electrical conductivity and compaction density and rebound properties of the two types of materials to have a deeper understanding of the properties of the two materials.
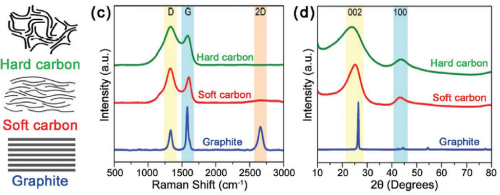
Figure 1.Structural differences in graphite, hard carbon, and soft carbon2
1.Test Method
1.1 Test Equipment: PRCD3100 is used for two kinds of graphite and two kinds of hard carbon powder. The equipment is as shown in Figure 2.
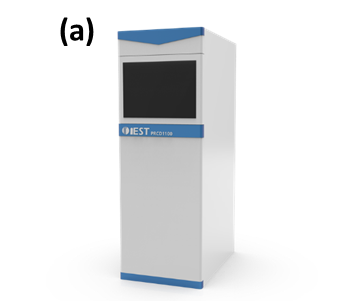 | 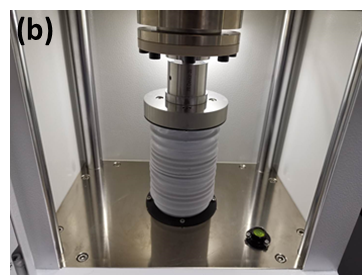 |
Figure 2. (a)PRCD3100 appearance diagram; (b)PRCD3100 structure diagram
1.2 Test Parameters: Apply a pressure range of 5-200MPa, with 20MPa interval, and pressure holding for 10s.
2.Test Results
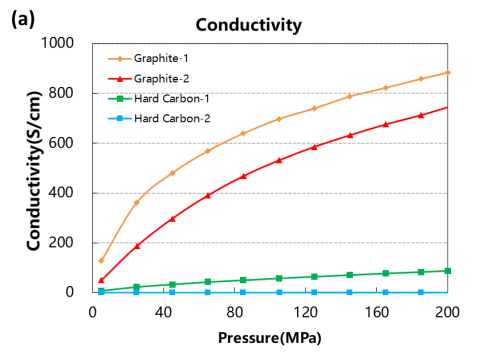
The conductivity and compaction density test curves of the four graphite and hard carbon materials are shown in Figure 3. From the result curves, the conductivity and compaction density of the two graphite materials are significantly greater than those of the two hard carbon materials. Different graphite materials also differ in conductivity due to their graphitization degree or structural morphology.
 |
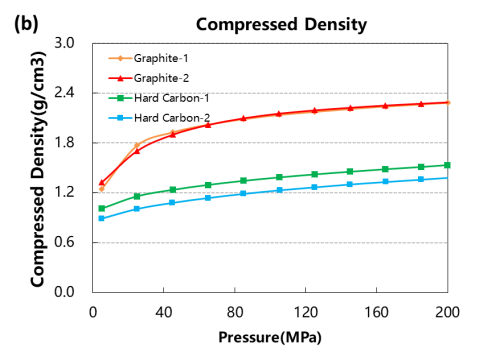 |
Figure 3. Electrical conductivity and compaction density curves of the four graphite and hard carbon materials.
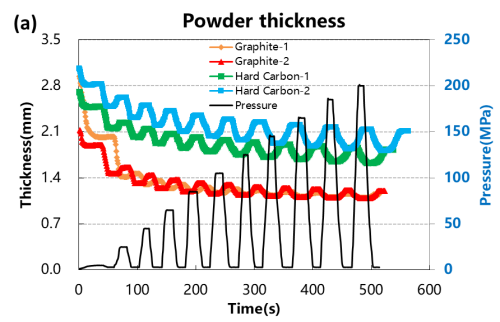
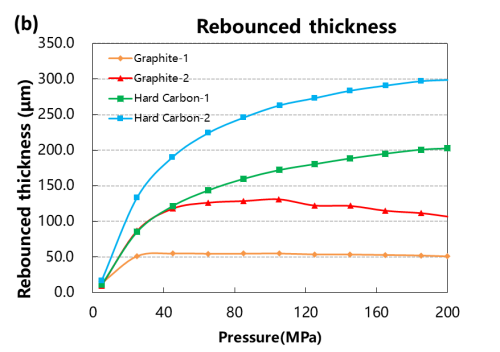
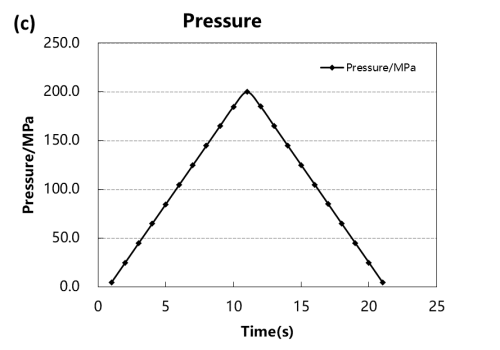
Test the pressure pressure and pressure relief of the four materials, load the pressure according to the pressure change curve as shown in Figure 4 (a), and adjust the corresponding material thickness change and the thickness rebound curve as shown in Figure 4 (a) and (b). When four powders of the same quality are taken for the compression test, the absolute thickness value of the hard carbon material and the change of the thickness rebound are greater than that of the graphite material.When the graphite material is at about 50MPa, the thickness rebound amount is relatively stable, while when the hard carbon material is above 50MPa, the thickness rebound amount is still gradually increasing. Using the maximum pressure relief, get the stress strain curve of Figure 4 (d), by analyzing the maximum shape variable, reversible shape variable and irreversible shape variable, as shown in Table 1, the reversible deformation of hard carbon material is greater than the graphite material, and from the perspective of the slope of the stress strain curve, the compression modulus of graphite material is less than the hard carbon material.The above results show that graphite materials can achieve a higher compaction density than hard carbon materials.
 |
 |
 |
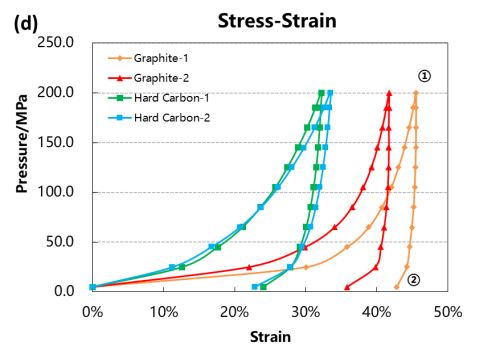 |
Figure 4. Stress and strain curves of the four materials
Table 1.Summary of Variable Data for the Four Materials

According to the above test results, the electrical conductivity of graphite is better than hard carbon, and the compression performance of the particle layer is better than hard carbon.The reasons for the structural differences between hard carbon and graphite, are shown in Figures 5 and 6.Graphite is a lamelayer structure, each layer of carbon into a planar hexagonal structure, a carbon atom around three carbon-carbon single bonds, and carbon atoms outer layer has four valence electrons, graphite each carbon atoms left a valence electron unbonded, between the lamina by van der Waals forces. When energized, these unbonded valence electrons will move directionally in the layer to form a current current, so the graphite electrical conductivity is better. However, due to the existence of molecular crosslinking and covalent C-O-C bonds in their precursor, hard carbon materials are more likely to form a rigid crosslinking structure in the process of pyrolysis, and produce a large number of defects, micropores and oxygen-bearing functional groups. These structures in the carbonization stage will inhibit graphite growth and orientation stacking, and form a large number of random distribution of curved graphite, even at 2500℃ and higher temperature, materials will not form graphite, can only form a short-range order, long-range disorder of graphite microcrystal structure, this structure hindered the directional movement of the electron, so the conductivity of hard carbon material is lower.In the process of material compression, the powder particles are first under pressure to shift the pores between the particles, the particle contact area increases, and the conductivity and compaction density increase accordingly.As the pressure increases further, the particles completely contact each other, most of the pores between the particles are filled, and the deformation resistance increases.The pressure continues to increase, making the particles to recoverable elastic strain, and the compaction density of graphite is close to the material authentic density of 2.3g / cm3And hard carbon inside a large number of microholes, under 200MP a pressure almost cannot be filled completely, so hard carbon compaction density is lower than graphite, but the hard carbon disorder is higher, the microstructure of carbon layer stacking and cross-link interaction, make its elasticity should change big, so the thickness of the hard carbon rebound after pressure discharge is bigger.
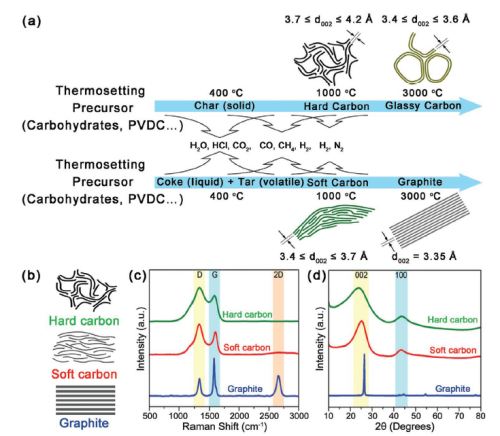
Figure 5. Formation and microstructure of graphite, hard carbon and soft carbon materials2
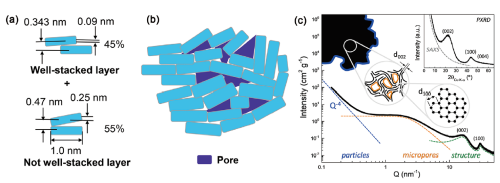
Figure 6. Schematic diagram of the structural analysis of the hard-carbon materials2
Summarize
In this paper, PRCD3100 tested the conductivity, compaction density and rebound properties of graphite and hard carbon powders, and found that the electrical conductivity of graphite is greater than that of hard carbon, and the compression performance of the particle level is greater than that of hard carbon, which is mainly related to the microstructure of the two materials. When both are used in batteries of different systems, in addition to electrical conductivity and compressibility, but also to consider their sodium storage or lithium storage performance.
Reference Documentation
1.Hu Yongsheng,Lu Jiaxiang,Chen Liquan,etc.,Sodium Ion Battery Science and Technology, Science Press,2020,134-137.
2.Lijing Xie, Cheng Tang, Zhihong Bi,et al.Hard Carbon Anodes for Next-Generation Li-Ion Batteries: Review and Perspective.Adv.Energy Mater.2021, 2101650.
