New Method for Monitoring Stability and Uniformity of Battery Electrode
With the wide application of lithium-ion batteries in the fields of mobile phones, computers, automobiles, energy storage, etc., people's demands for battery safety, energy density and power density performance are increasing. In order to improve the energy density and power density of lithium ion batteries, some new materials and technologies for lithium batteries need to be developed urgently. Lithium-ion battery production is composed of multiple processes. In order to obtain a battery with high safety and reliability and good performance consistency, it is necessary to develop strict monitoring measures for each production process to ensure that defective products do not flow into the market. In order to save production costs and improve production efficiency, battery companies hope that they can quickly identify abnormalities in the pre-process stage and make corresponding improvement measures in time. The monitoring methods commonly used by most battery companies in the previous process mainly include monitoring the following parameters: slurry viscosity, slurry solid content, coating quality, and compaction density. Although these methods can monitor the process fluctuations to a certain extent, they are not enough. To meet the requirements of monitoring the consistency of finished batteries. The battery electrode is an important output of the battery front-end process. The electronic resistance (conductivity) of the battery electrode affects the power, reliability and safety of the entire battery. At the same time, it is closely related to the stirring, coating and rolling processes. Therefore, the measurement The change of the battery electrode resistance can better evaluate the performance of the electronic conductive network during the production of the battery electrode, evaluate the uniformity of the electrode microstructure and monitor the stability of the battery electrode, manufacturing process, and help improve the formulation of the battery electrode as well as the mixing, coating and Control parameters of the rolling process.
At present, there are two main principles for testing the electronic resistance of a battery electrode: the four-probe method and the two-probe method. The four-probe method can only characterize the resistance of the coating on the surface of the battery electrode, ignoring the interface resistance of the coating and the current collector, which is inconsistent with the actual use of the battery electrode in the battery, so it is not used to test the resistance of the battery electrode of the lithium ion battery 1- 2. The two-probe method can characterize the overall penetration internal resistance of the battery electrode, including the coating resistance, the resistance of the coating and the current collector interface, and the resistance of the current collector itself, the electron conduction path during the test and the electron when the battery electrode is actually used in the battery The conduction path is the same, and most companies and scientific researchers use this method to characterize the resistance of the battery electrode 2-4. The method used in this article is to make further improvements on the basis of the two-probe method. The four-wire method is used to add a controllable voltage double disk electrode to test the electronic resistance of the battery electrode and monitor the change of the battery electrode resistance in the coating and rolling process. The risk control of the battery cell is advanced to the battery electrode end, thereby escorting the research and development and production of lithium ion batteries.
1.Experimental Equipment and Test Methods
1.1 Experimental Equipment: Model BER1300 (IEST), electrode diameter 14mm, applied pressure 25MPa, holding time 25s.
The Equipment is Shown in Figure 1(a) and 1(b)
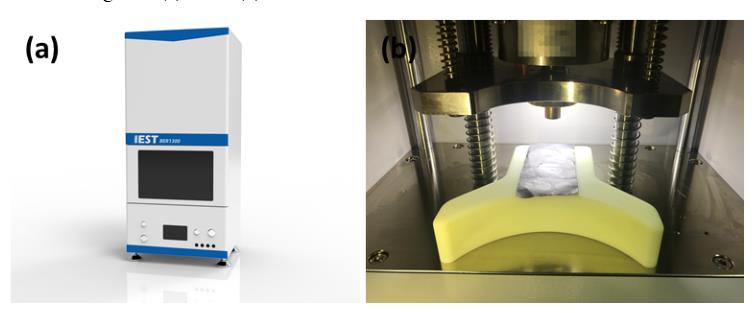
Figure 1.(a) BER1300 appearance diagram; (b) BER1300 structure diagram
1.2 Test Method: Cut the rolled battery electrode into a rectangular size of about 5cm×10cm, place it between the two electrodes of the battery electrode resistance meter, set the test pressure and holding time parameters on the MRMS software, start the test, the software automatically Read data such as battery electrode thickness, resistance, resistivity, and conductivity.Each battery electrode is randomly selected for testing at 10 positions,and the coefficient of variation COV is calculated according to formula.
(1)The larger the COV, the worse the battery electrode uniformity.

(2)Where n represents the number of tests and R represents the average of all test resistances.
2.Process Monitoring Case
2.1 Battery Electrode Batch Stability Monitoring
The resistance of the battery electrode is affected by various factors such as dispersion of the conductive agent, coating weight, cold-pressing parameters, etc., and the influence of the conductive agent on the resistance is very significant3. The dispersion of the positive electrode conductive agent is related to many complex process control parameters such as slurry formulation, stirring conditions, coating/drying conditions, etc. The uneven dispersion of the conductive agent will greatly deteriorate the battery dynamics performance, but the unevenness is difficult to pass Conventional monitoring methods such as film appearance and adhesive strength are often found to be easily overlooked, causing irreparable losses.
In the early stage of cell research and development, through extensive testing and monitoring of the ternary battery electrode resistance, a normal battery electrode resistance range of 0.2~0.4Ω was initially established. After the cell was introduced into mass production, resistance monitoring of different batches of battery electrodes was carried out. Figure 2(a) is a battery electrode resistance test conducted on 6 batches of battery electrodes. The black data points represent the single test resistance value, the red data points represent the average resistance, and the green data points represent the resistance COV. From the resistance data, it can be found that there are 3 batches of cell battery electrodes with a resistance greater than 0.4Ω, which obviously exceeds the specifications. Further SEM morphology analysis is performed on the battery electrodes of normal and abnormal batches, as shown in Figure 2(b) and 2(c), The distribution of conductive carbon in the battery electrodes of normal batches is more uniform, and the conductive carbon in the battery electrodes of abnormal batches has obvious agglomeration phenomenon. Because the battery electrodes are randomly selected at different positions when testing the resistance of the battery electrodes, uneven distribution of conductive carbon will cause the resistance of the battery electrode at the position where there is no conductive carbon increases significantly. Therefore, by monitoring the change in the resistance of the battery electrode, an abnormal battery electrode can be quickly identified at the battery electrode end, to prevent the bad battery electrode from flowing into the next process, and to save production costs.
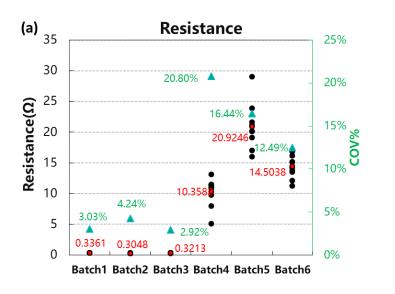
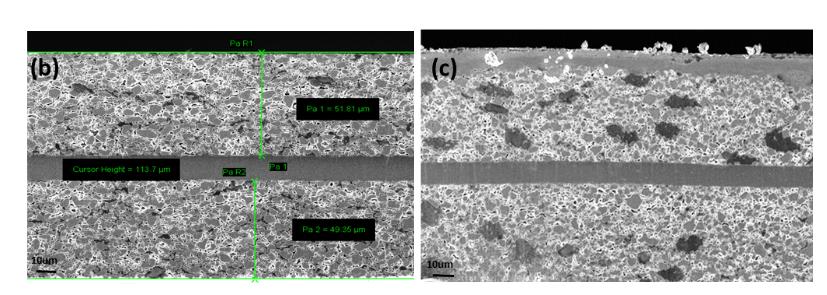
Figure 2.(a) 6 batches of battery electrode resistance. (b) batch 1 battery electrode SEM image. (c) batch 4 battery electrode SEM image.
2.2 Battery Electrode Coating Uniformity Monitoring
In order to improve the energy density of batteries, the research on silicon-carbon mixed materials as anode materials for lithium-ion batteries is gradually increasing. How to control the uniformity of the distribution of silicon-carbon mixed materials in the battery electrodes has a significant effect on the expansion of the negative electrode and the potential distribution. Monitoring the change of the battery electrode resistance under different process parameters can evaluate the mixing uniformity of silicon carbon materials.
Figure 3 shows the results of battery electrode resistance test and SEM morphology characterization of the battery electrodes of the two mixing processes. From Figure 3(a), it can be seen that the average value of the battery electrode resistance and COV of Mixing 1 are significantly higher than those of Mixing 2, indicating that the uniformity of Mixing 1 is worse than that of Mixing 2. Combined with the SEM morphological analysis of Figures 3(b) and 3(c), it can be seen that the mixing of the silicon and carbon in the electrode of Mixing 1 is not uniform, and there are more individual silicon particles, which results in an increase in the average value of the electrode resistance , and the resistance of the battery electrodes at different positions is large, so the resistance COV is large, and the silicon carbon in the Mixing 2 is relatively uniformly mixed, and the average resistance and COV are both small, which further proves the mixing process corresponding to the Mixing 2 better.
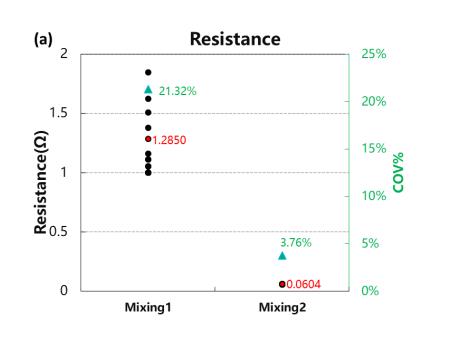
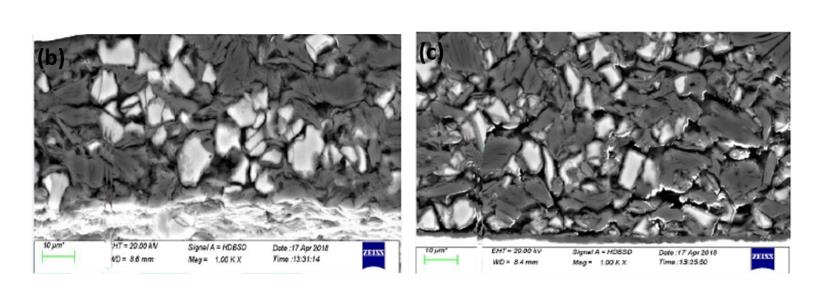
Figure 3.(a)Two kinds of mixed electrode resistance. (b)SEM image of the mixing 1 battery electrode. (c)SEM image of the mixing 2 battery electrode.
3.Conclusion
In this paper, the four-wire method plus controllable voltage double disc electrode method is used to test the resistance of the battery electrode, which can be better used to monitor the stability and uniformity of the battery electrode process, and the battery electrode resistance data can be connected to the BIS or MES system in real time. To achieve recordable and traceable data. At present, many material and battery companies have introduced this method into the production line process monitoring to quickly and effectively evaluate the process parameters and process stability, advance the risk control of the battery core to the battery electrode end, and accelerate the development of lithium-ion batteries to satisfy the market's needs.
References
1.Xu Jieru, Li Hong, et al.,Conductivity measurement and analysis methods in lithium battery research Energy storage science and technology,2018,7(5) 926-955.
2.Hiroki Kondo et al. Influence of the Active Material on the Electronic Conductivity of the Positive Electrode in Lithium-Ion Batteries. Journal of The Electrochemical Society, 2019,166 (8) A1285-A1290.
3.B.G. Westphal et al. Influence of high intensive dry mixing and calendering on relative electrode resistivity determined via an advanced two point approach. Journal of Energy Storage 2017, 11, 76–85.
4.Nils Mainusch et al. New Contact Probe and Method to Measure Electrical Resistances in Battery Electrodes Energy Technol. 2016, 4, 1550-1557.
