New Perspective on Assessing the Correlation between Lithium-Ion Powder Resistivity and Electrode Resistance
1. Background
With the rapid development of the lithium-ion battery industry, there is an increasing concern regarding the safety and stability during battery usage. The main causes of performance degradation in lithium-ion batteries can be summarized as active lithium loss, active material loss, and polarization loss. In practical lithium-ion battery development, characteristics and their evolution at various levels from raw materials to electrode preparation and finished cell assembly can influence battery performance. Therefore, establishing a multi-level correlation from powder materials to electrodes and then to batteries is crucial in lithium-ion battery research and is currently a focus of attention among lithium battery researchers.
As a self-developed equipment company, IEST is not only focused on the performance of the equipment itself but also dedicated to seeking breakthroughs in mechanism analysis methods. In earlier work, independent experiments were conducted, employing five different resistivity ternary powders with a fixed solid content of 53.3%. A slurry was prepared at a mass ratio of 96.5:1.5:2 (active material: conductive carbon: PVDF). Systematic coating, rolling, punching, and tab welding were carried out. The correlations at each level were analyzed, combining changes in conductivity of powder, slurry, electrode, and tab. Figure 1 illustrates the schematic diagram of these correlations. Test results indicated that from the powder level to the slurry level, due to the addition of other additives and solvents during slurry preparation, along with the fluctuation in preparation processes, the trend of conductivity did not demonstrate complete consistency. Regarding the direct current internal resistance at the tab level, inconsistencies in correlation were also observed due to factors such as electronic resistance, charge transfer resistance, and lithium-ion diffusion resistance in each tab component. However, for materials with significant differences at the powder level, such as materials 1 and 5, the correlations at each level remained relatively consistent.
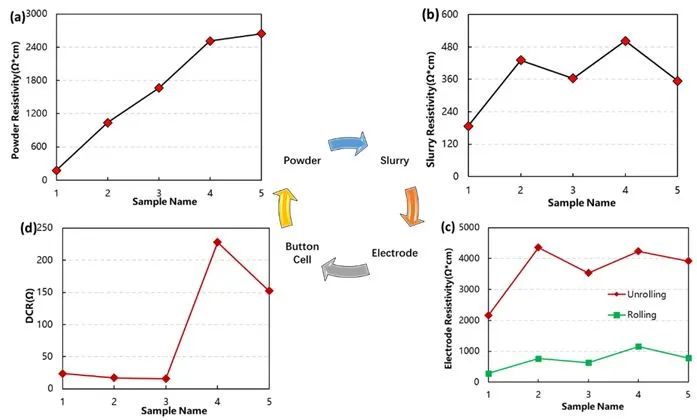
Figure 1: Analysis of Correlation at Different Levels in Lithium Battery
From powder to mixed powder premixing, to slurry, and then to electrode levels, the microstructure and composition exist in different forms, as shown in Figure 2. For the conductivity at the powder level, since it only contains active particles, the conductivity under a certain compaction state can be expressed as: σAM = σ0 * φ / τ, where σ0* is the conductivity of the powder itself, φ is the volume fraction of powder particles in the compacted state, and τ is the tortuosity of the powder particle connectivity, related to the contact state between particles. The better the connectivity and the larger the contact area between particles, the smaller τ is. During the powder conductivity testing process, as the pressure increases, the compaction density increases, the volume fraction of particles φ increases, the connectivity and contact between particles improve, τ decreases, and thus the powder conductivity increases.
From the mixed powder premixing state to the slurry, and then to the electrode, conductive agents and binders are introduced into the active particle powder. Conductive agents facilitate the construction of an electron transfer network, while binders increase the electron transfer impedance. The conductivity of mixed powder, slurry, or electrode coating can be divided into two parts: the conductive network formed by the interconnection of active particles and the conductive network formed by the conductive agents, and of course, the contact between the two can also form an electron transfer network. At this point, the effective conductivity can be expressed as:

Where σeff e represents the effective electrical conductivity; φact is the volume fraction of active particle powder; τact is the tortuosity of the active particle powder, with better connectivity and larger contact area resulting in smaller tortuosity τ of the electron conduction path; σact is the electronic conductivity of the active particles themselves. φsub is the volume fraction of conductive agent powder, τsub is the tortuosity of the conductive agent powder, and σsub is the electronic conductivity of the conductive agent particles themselves. Generally, the intrinsic conductivity of active particles is much lower than that of conductive agents, especially in the positive electrode.
Therefore, the electronic conductivity contributed by active particles is very low, and the conductive agent serves as the primary pathway for electron conduction. Thus, the distribution and connectivity of the conductive agent are the main factors influencing the electronic conductivity. Compared to pure powder, the introduction of conductive agents and binders from the slurry to the electrode directly affects the assessment results of electronic conductivity. From the mixed powder premixing state to the slurry, and then to the electrode, the correlation of electronic conductivity is mainly related to the distribution state and connectivity of components, especially the connectivity network of conductive agents. If this conductive network can be maintained throughout the process, the conductivity at each level will be fully correlated.
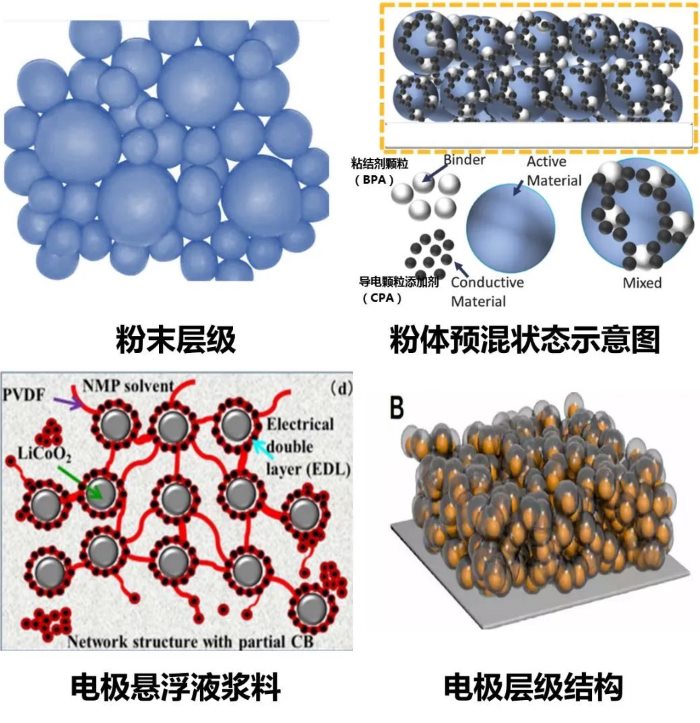
Figure 2: Microscopic Morphology of Particles at Each Level
The correlation at each level from raw materials to device is a significant topic in the field of lithium batteries. Looking at it from another perspective, the ultimate focus has always been on the performance of the final battery cell. However, in the current state, strict quality control at each level is crucial. Yet, if the root cause of a problem could be identified at an earlier stage, it would enable the anticipation of issues, further avoiding significant waste of time and cost. IEST has always been responsive to the demand for level correlation from collaborative clients, particularly regarding the correlation between powder resistivity and compaction density with electrode resistivity and compaction density. The laboratory has explored various methods in the process of mechanistic exploration to seek breakthroughs in correlation. This article aims to share insights based on some exploratory work that has already been done.
2.Correlation between Resistivity of Lithium Battery Powder in Premixed State and Resistance at Electrode Level
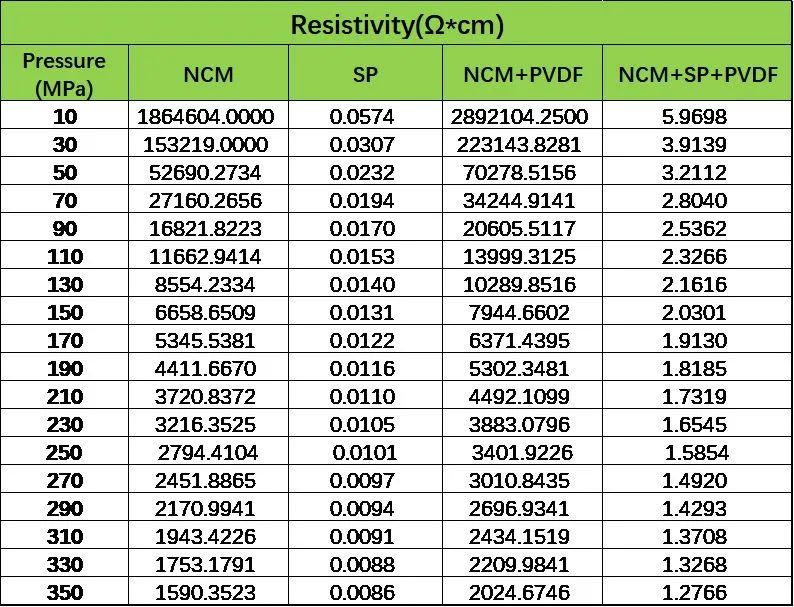
In the exploration of the correlation between different levels (Figure 1), it was found that the correlation between the powder level and the electrode level is inconsistent (significantly influenced by the conductive agent), but the correlation from the slurry to the electrode level is entirely consistent. The main consideration is still the process from powder to slurry to electrode, where the introduction of conductive agents and binders directly affects the assessment of electronic conductivity. To further clarify these influences, the laboratory designed experiments using NCM materials as the main component, referencing the premixing part of the dry mixing process, and prepared different ratios of mixed powders by fully mixing NCM:PVDF=19:1 and NCM:PVDF:SP=18:1:1. Subsequently, the resistance of the different mixed powders was evaluated using the PRCD series equipment to further clarify the differences in electronic conductivity before and after powder mixing. Table 1 shows the difference in resistance measurement results before and after powder premixing. From the results, after mixing PVDF into NCM, the conductivity of the mixed samples deteriorated compared to pure NCM powder due to the poor conductivity of powdered PVDF. However, simultaneously mixing the well-conductive SP effectively improved the conductivity of the mixed powder. This further clarifies that the improvement in conductivity at the electrode level relative to the powder material is mainly attributed to the introduction of conductive agents. In the exploration of the correlation between powder-level resistivity and electrode-level resistivity, attempting to establish a correlation through the resistivity of powder in the premixed state is a feasible approach. Currently, the elements have been gradually improving their own tab wires, and in the next stage, they will combine their own stirring, coating, and rolling processes to further clarify the feasibility of this approach.
Table 1: Differences in Resistivity Measurement Before and After Powder Premixing
3.Exploration of the Correlation between Lithium Battery Electrode Resistance and Coating Layer Powder Resistivity
In experiments with premixed powders, one point of interest may be the clear differences between the introduction of conductive agents and binders at the electrode level compared to pure powder premixing. After the mixing process at the slurry level, PVDF exists in a sol state with the introduction of solvents, which differs significantly from the premixing stage. Similarly, after drying at the electrode level, there are distinct differences compared to premixing. Concerns about this aspect were also raised by colleagues at Element, prompting the simultaneous design of scraping powder at the electrode level. This involved testing the resistivity of the powdered state after scraping, and evaluating its correlation with the resistivity at the electrode level using BER and PRCD series equipment.
In this part of the experiment, NCM and LCO electrodes, both unrolled, were selected as samples. These samples were subjected to resistivity testing at different points under a pressure of 25 MPa to ensure reasonable uniformity of coating on the selected electrodes and to avoid introducing significant differences among the points during the variable-pressure testing stage. Figure 3 shows the schematic diagram of the BER series equipment and the single-point test results of the selected electrodes. Six points at different positions of each electrode were selected, and the coefficient of variation (COV) of their resistivity was calculated. From the results, the COV of the selected electrodes was all below 5%, indicating good uniformity. This preliminary clarification confirms that the selected electrodes have good uniformity and can be used as samples for evaluation in this experiment.
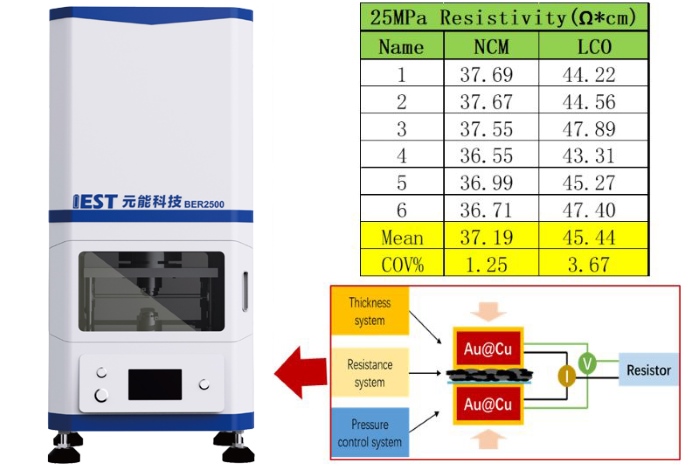
Figure 3: Schematic Diagram of the BER Series Equipment and Single-Point Test Results of Electrodes
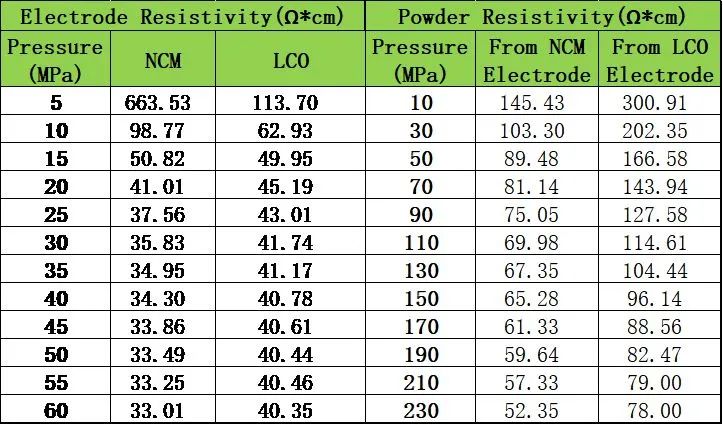
Following the experimental design approach, both types of electrodes were subjected to powder scraping treatment to collect the coating layer powder from the current collector surface. The scraped powder was then crushed to ensure uniform sampling during the resistivity measurement process. Figure 4 shows the schematic diagram of the PRCD series equipment and the resistivity measurement results of the electrode coating layer powder. From the curves, it can be observed that the coating layer powder exhibits the same trend as pure powder, with resistivity gradually decreasing with increasing pressure. To further clarify the differences, a comparative analysis was conducted between the electrode resistivity and the resistivity of the coating layer powder. Table 2 presents the comparison of the measured results. From the results, there was no significant difference in magnitude between the two sets of data. Additionally, considering the differences in resistivity between the two categories, the resistivity of LCO in both states was greater than that of NCM. Preliminary findings suggest that this approach is reasonable and effective. However, due to limitations in sample selection, the current experimental verification is not comprehensive enough. Further experiments are needed to verify different process conditions within the same primary material category systematically. Additionally, apart from comparing scraped coating layer powders, consideration is being given to directly crushing the slurry after simulating the drying process at the slurry level or directly drying the slurry, to correlate with electrode performance. If this approach proves feasible, it raises the question of whether it is possible to estimate electrode-level performance without coating. Further experiments need to be designed internally at Element to address these points systematically in the next steps.
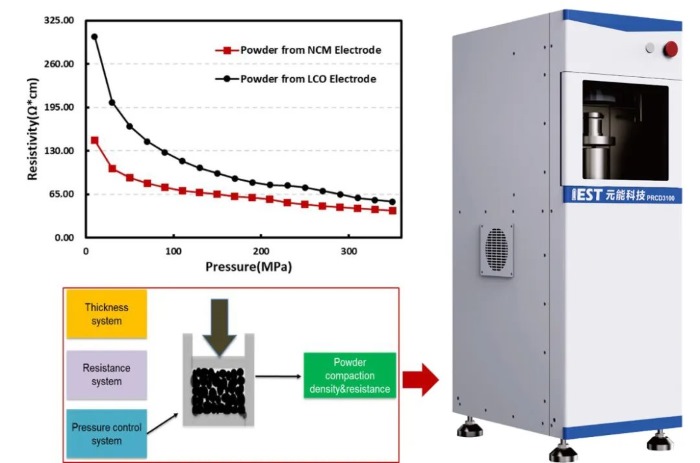
Figure 4: Schematic Diagram of the PRCD Series Equipment and Resistivity Measurement Results of Electrode Coating Layer Powder
Table 2: Comparison Table of Electrode Resistance and Coating Layer Powder Resistivity
4.Summary
With the accelerating pace of industry development, the correlation between different levs of lithium batteries has always been a focal point, particularly concerning the conductivity of materials and the assessment of cell performance and safety. This article, drawing from laboratory testing experience, offers some new insights into the correlation between powder resistivity and electrode resistivity. Through experiments involving premixing and testing at the powder level, the direct impact of binders and conductive agents on resistivity was elucidated. Additionally, considering the influence of solvent introduction and differences in binder states, comparative testing of scraped coating layer powder from finished electrodes was conducted. Preliminary evaluations suggest this approach could be an effective means for exploring correlations. Next, IEST will refine the experimental protocols to drive a more systematic correlation assessment.
